Price analysis 8/26: SPX, DXY, BTC, ETH, BNB, SOL, XRP, DOGE, TON, ADA
Bitcoin and altcoins are witnessing some profit taking today, but the overall uptrend remains intact.
Bitcoin (BTC) has made a sharp comeback from its August low of $49,000, but history does not support the continuation of the recovery in September. According to CoinGlass data, Bitcoin has dropped an average of 4.78% since 2013. In the past seven years, Bitcoin has witnessed a positive monthly gain only in 2023.
However, that has not deterred investors from buying Bitcoin-related exchange-traded products (ETP). CoinShares’ latest report shows that Bitcoin-related ETPs witnessed $543 million in inflows last week.
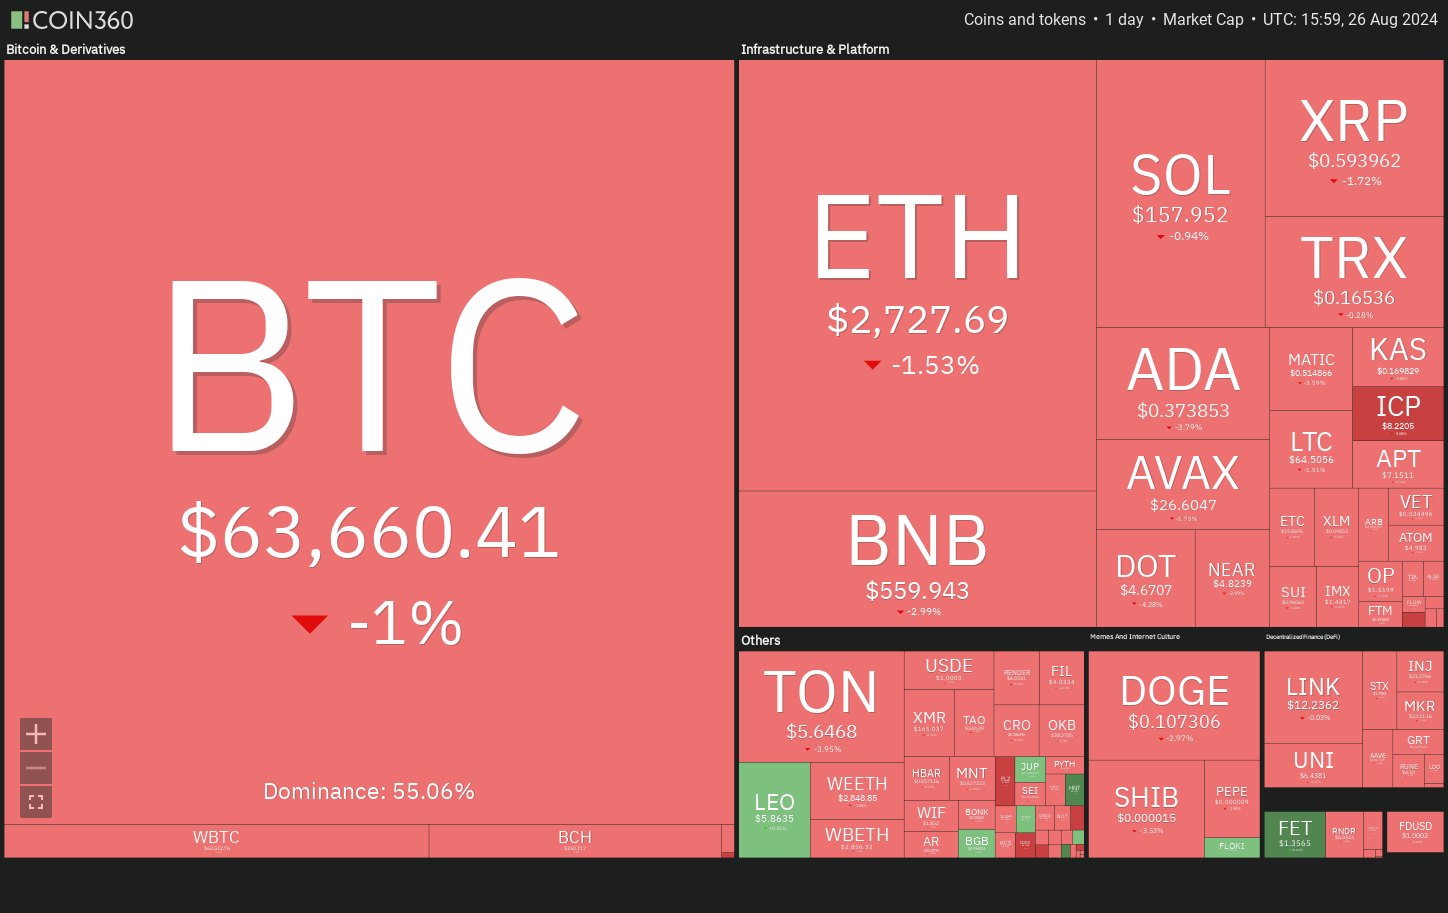
Daily cryptocurrency market performance. Source: Coin360
Bitcoin has largely been stuck inside the $55,724 to $73,777 range for the past several months, indicating a tough battle between the bulls and the bears for supremacy. The longer the time spent inside the range, the greater the force needed for the price to break out from it.
Could Bitcoin rise above $65,000 and march toward $70,000? Will altcoins also march higher? Let’s analyze the charts to find out.
S&P 500 Index price analysis
The S&P 500 Index continued its northward march last week and reached near the overhead resistance of 5,670
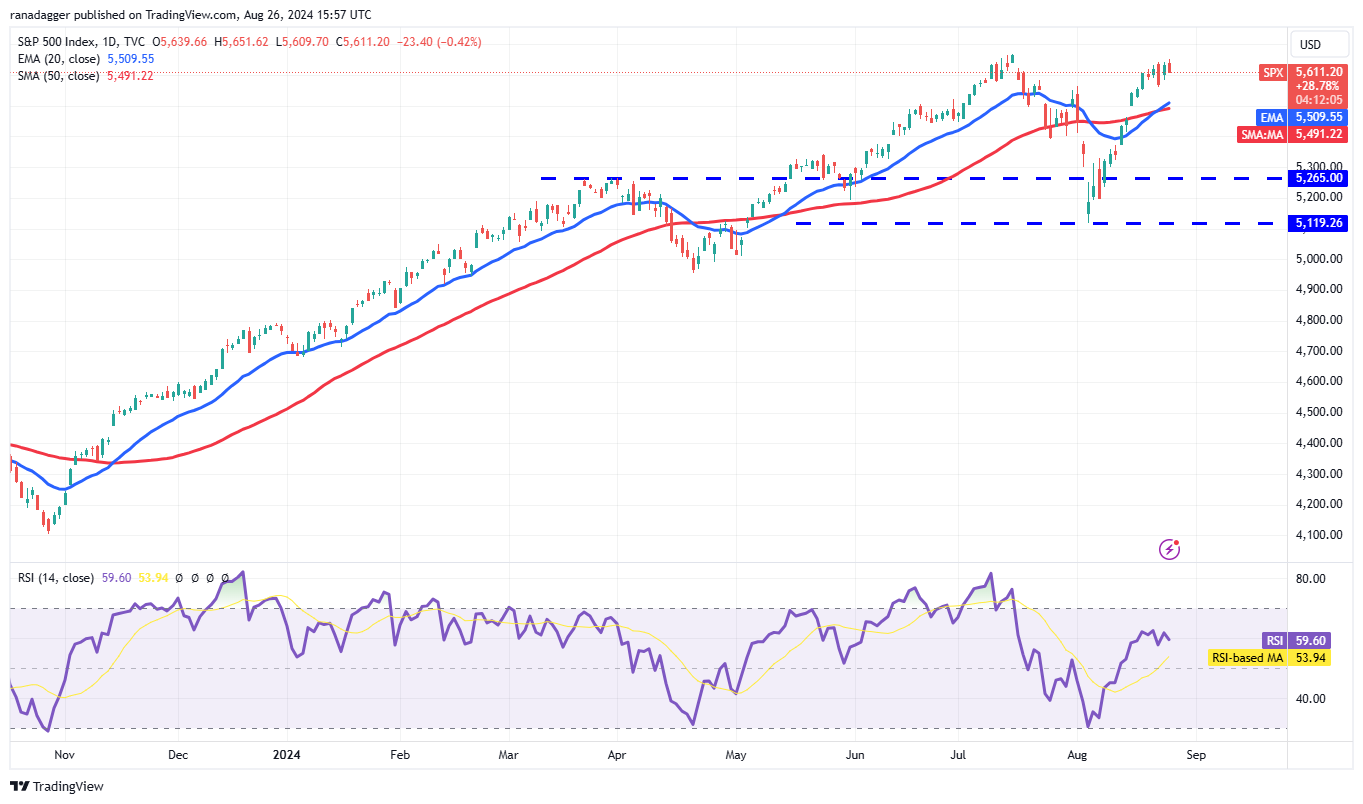
SPX daily chart. Source: TradingView
The 20-day exponential moving average (5,509) has started to turn up and the relative strength index (RSI) is in the positive zone, signaling advantage to buyers. A break and close above 5,670 could start the next leg of the uptrend to 6,000.
Time is running out for the bears. If they want to make a comeback, they will have to swiftly yank the price below the moving averages. If that happens, the index may get stuck between 5,119 and 5,670 for a while.
US Dollar Index price analysis
Sellers took charge of the US Dollar Index (DXY) last week and pulled the price below the crucial support at 101.
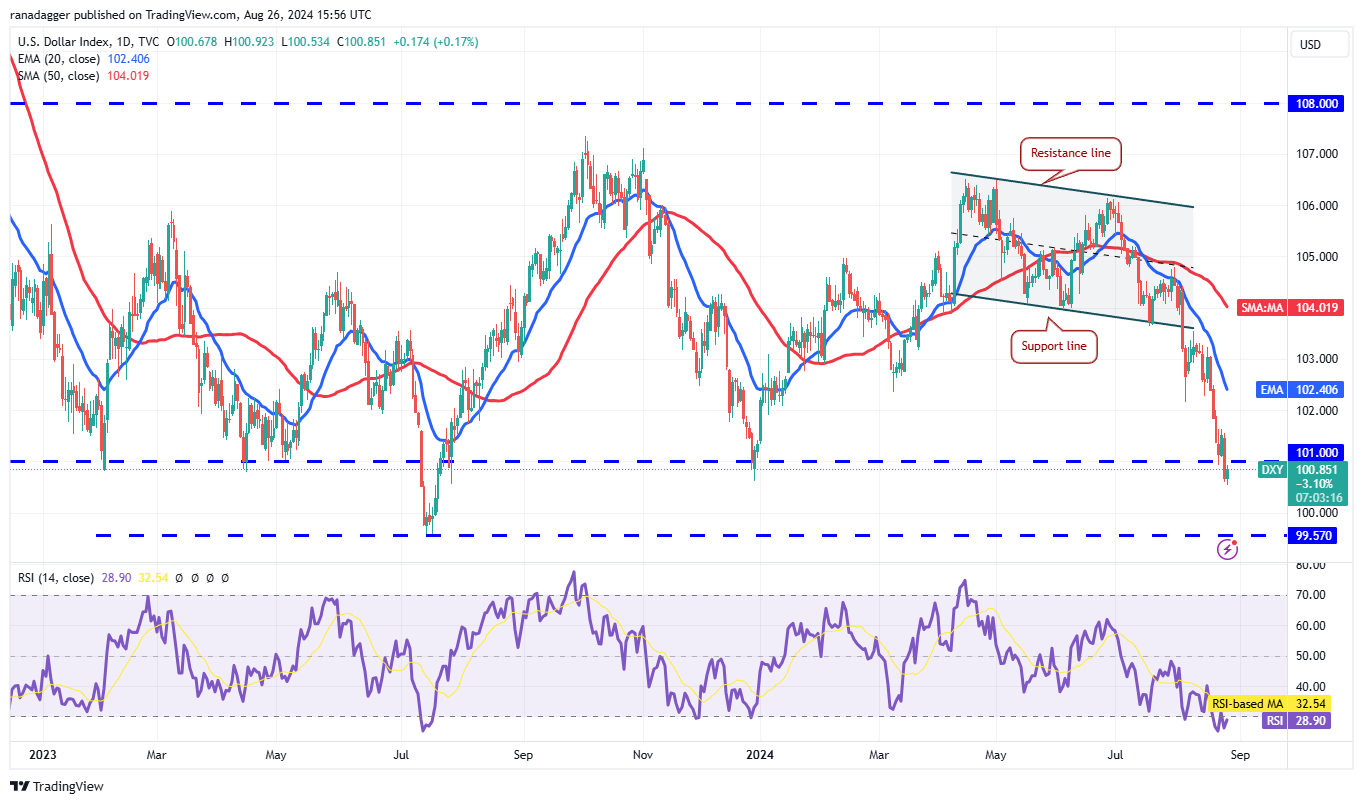
DXY daily chart. Source: TradingView
The sharp fall has sent the RSI into the oversold territory, indicating that the bears are firmly in the driver’s seat. Any recovery attempt is likely to face selling at 101.50 and again at the 20-day EMA (102.40).
If the price continues lower or turns down from the overhead resistance, it will signal that the sentiment remains bearish. The next stop on the downside is 99.57. Buyers will have to drive the price above the 20-day EMA to gain strength.
Bitcoin price analysis
Bitcoin is finding it difficult to rise above the $65,000 resistance, but a positive sign for the bulls is that they have not ceded ground to the bears.
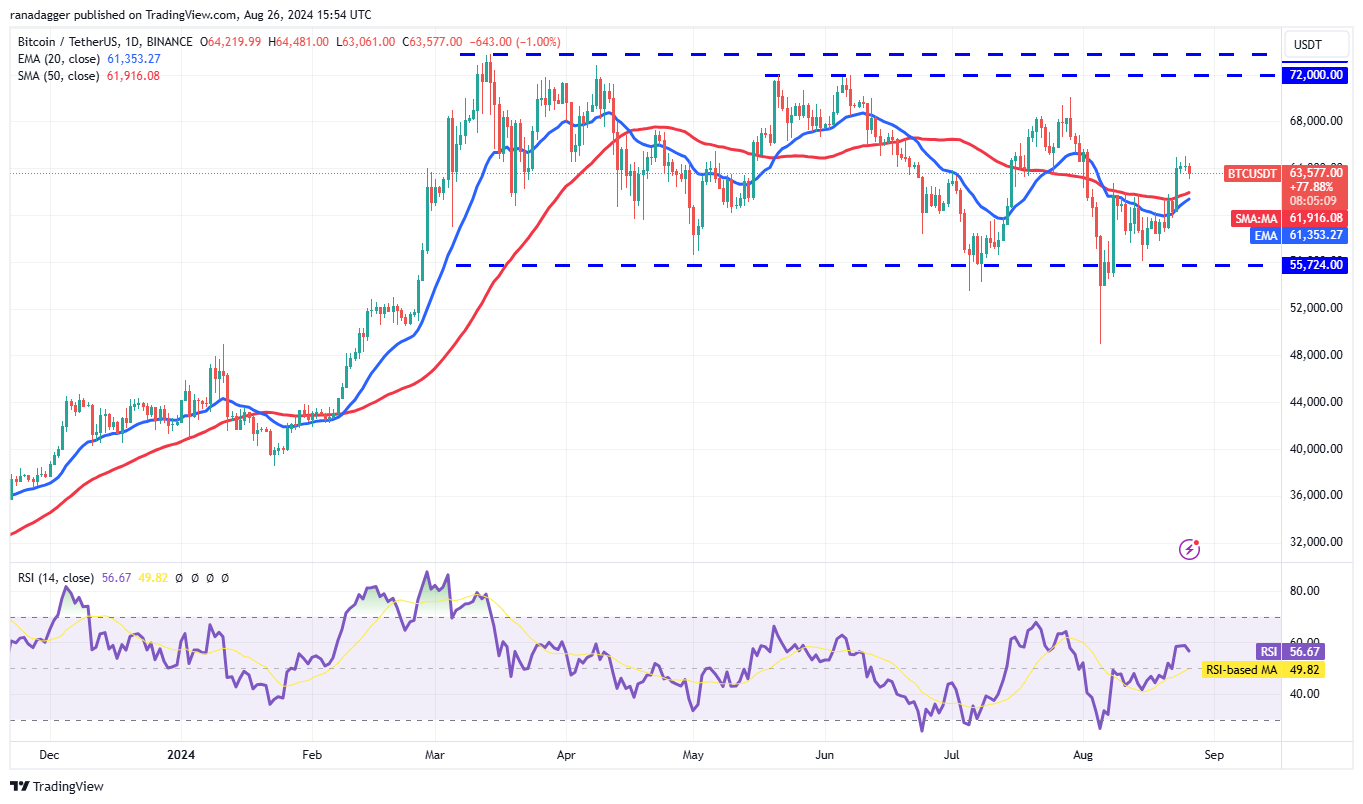
BTC/USDT daily chart. Source: TradingView
The 20-day EMA ($61,353) has started to turn up, and the RSI is maintaining in the positive territory, indicating that the bulls have the advantage. If the BTC/USDT pair rebounds off the 20-day EMA, the likelihood of a rally to $70,000 increases. The bears are expected to mount a strong defense in the $70,000 to $73,777 zone.
On the downside, a break and close below the moving averages could open the doors for a fall to $55,724, where the buyers are likely to step in.
Ether price analysis
Ether (ETH) turned down from the breakdown level of $2,850, indicating that the bears are trying to flip the level into resistance.
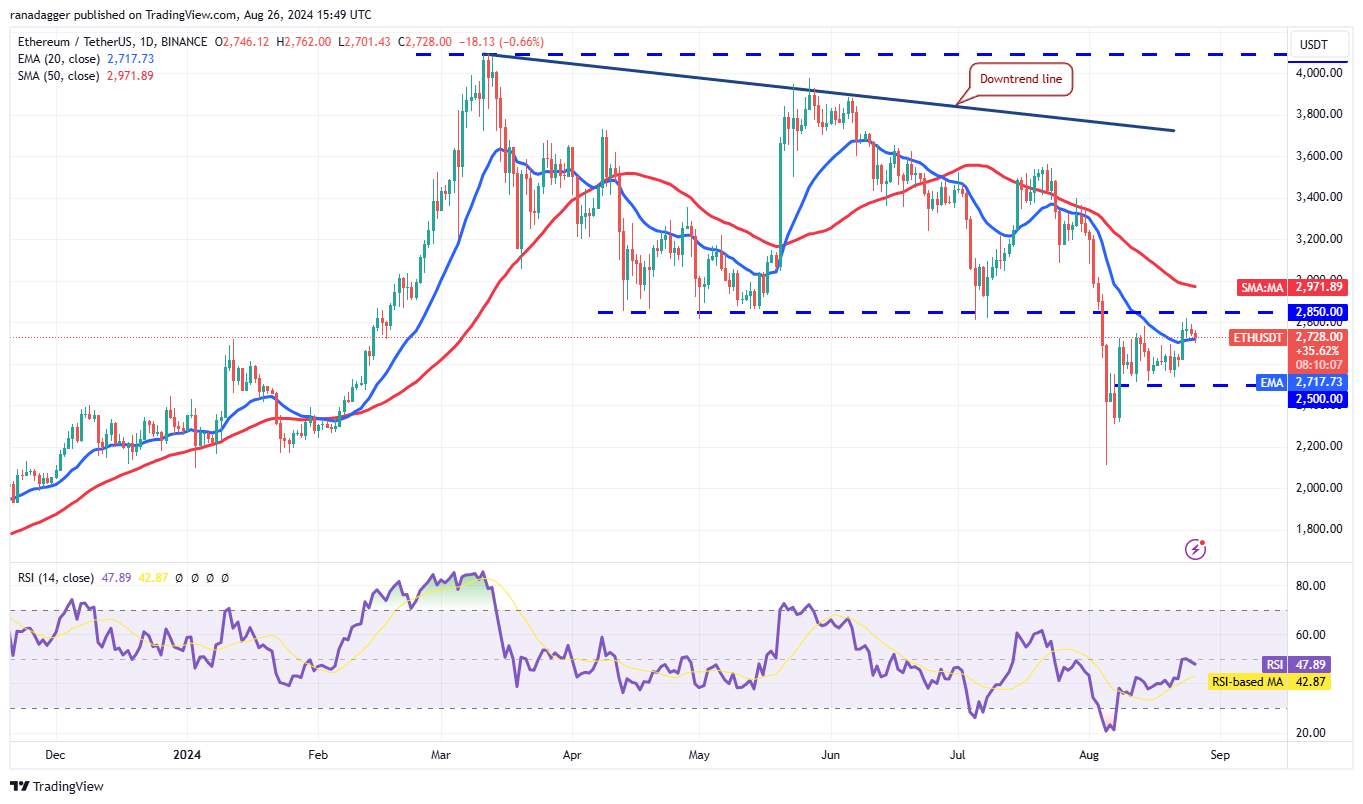
ETH/USDT daily chart. Source: TradingView
If buyers do not allow the price to sustain below the 20-day EMA ($2,717), it will signal that the dips are being bought. That will improve the prospects of a rally above $2,850. A break and close above the 50-day SMA ($2,971) will suggest that the downtrend may be over.
Alternatively, a sharp break below the 20-day EMA will suggest that the bears remain in control. The ETH/USDT pair may then consolidate between $2,500 and $2,850 for some more time.
BNB price analysis
BNB (BNB) turned down from $600 on Aug. 23, indicating that the bears are attempting to keep the price inside the $460 to $635 range.
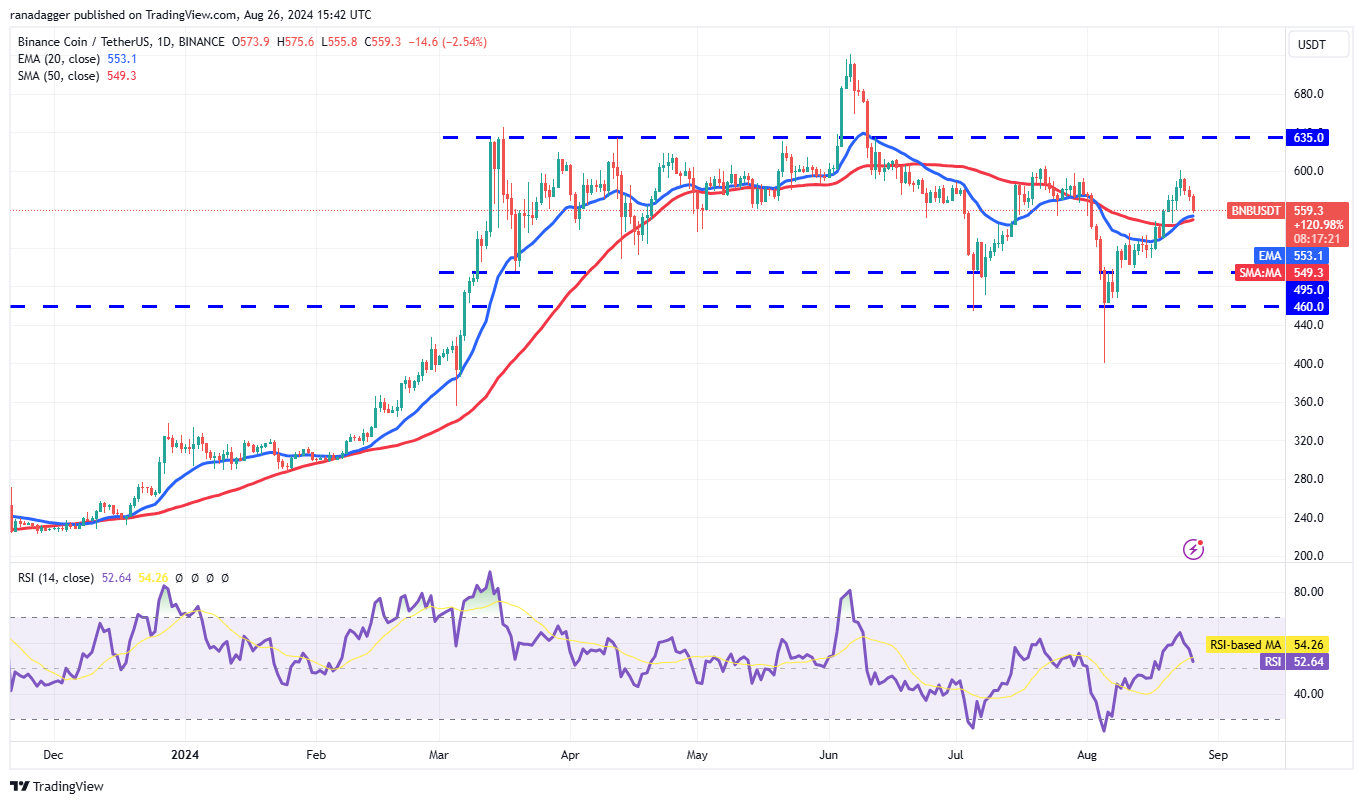
BNB/USDT daily chart. Source: TradingView
The moving averages are likely to act as a strong support. If the price rebounds off the moving averages with strength, it will suggest a positive sentiment where the dips are being purchased. The BNB/USDT pair may then attempt a rally to the significant hurdle at $635.
On the contrary, if the price continues lower and breaks below the moving averages, it will suggest that the bulls have given up. The pair may then slump to the strong support zone between $495 and $460.
Solana price analysis
Solana (SOL) broke and closed above the 50-day SMA ($155) on Aug. 24, indicating that the selling pressure is reducing.
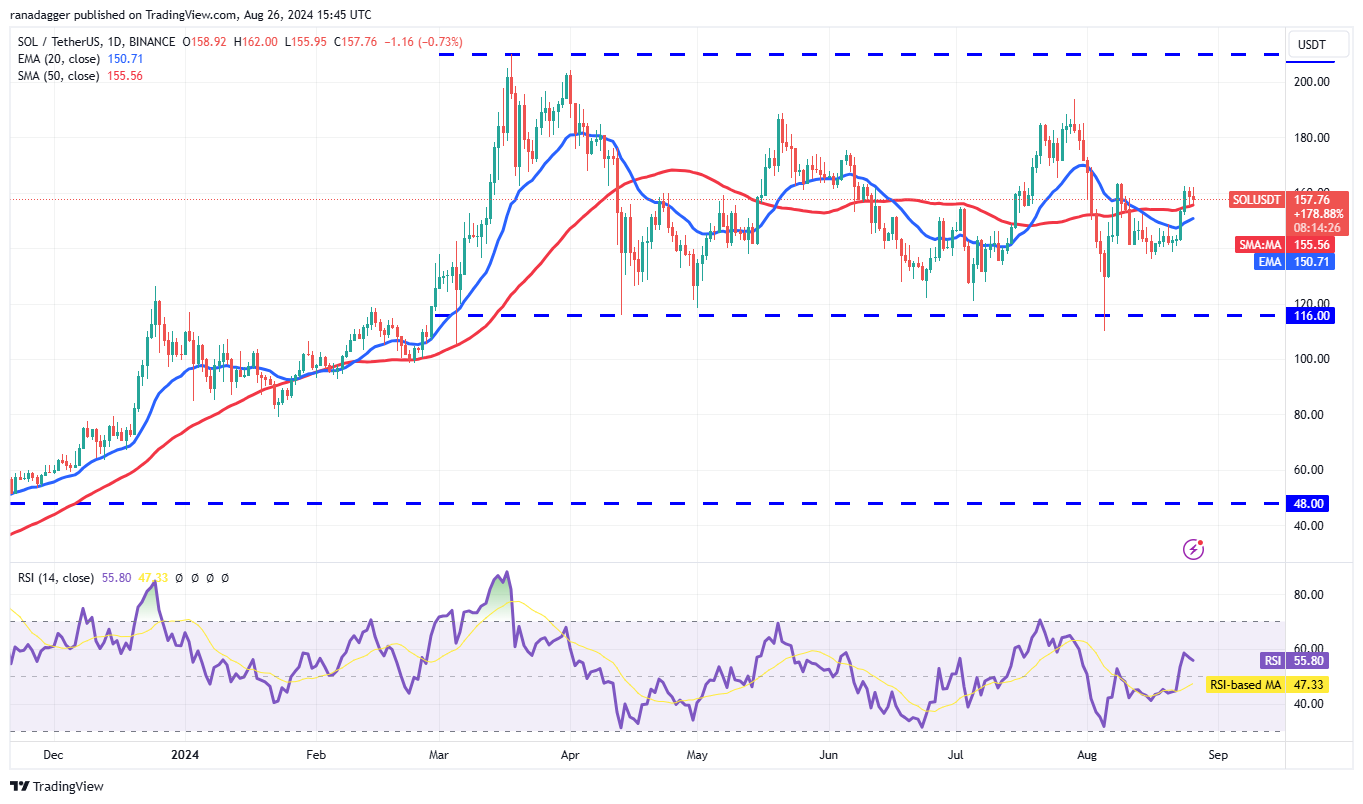
SOL/USDT daily chart. Source: TradingView
The 20-day EMA ($150) has started to turn up, and the RSI has risen into the positive territory, suggesting that the path of least resistance is to the upside. If buyers kick the price above $164, the SOL/USDT pair is likely to pick up momentum and surge to the overhead resistance at $186.
Contrarily, if the price turns down and breaks below the 20-day EMA, it will suggest that the bears are active at higher levels. The pair may then slide to the $136 support.
XRP price analysis
XRP (XRP) returned from the $0.64 resistance on Aug. 24, signaling that the bears are aggressively defending the level.
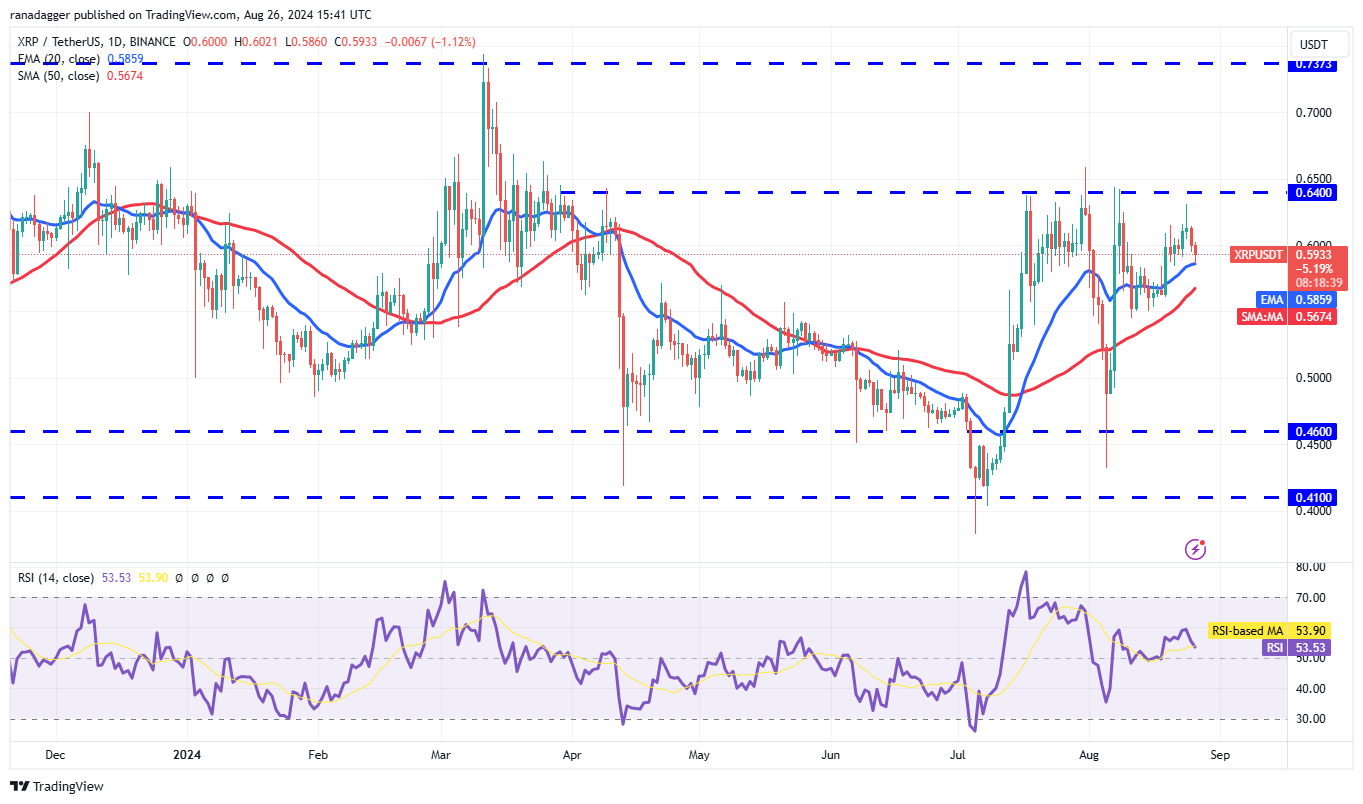
XRP/USDT daily chart. Source: TradingView
The first support to watch on the downside is the 20-day EMA ($0.58) and then the 50-day SMA ($0.56). If the price turns up from the moving averages, it will signal that the bulls are buying on minor dips. The bulls will then make one more attempt to clear the overhead hurdle at $0.64. If they succeed, the XRP/USDT pair may reach $0.74.
This positive view will be invalidated in the near term if the price turns down and breaks below $0.54. That will keep the pair inside the $0.41 to $0.64 range for a few more days.
Related: Here’s what happened in crypto today
Dogecoin price analysis
Dogecoin (DOGE) turned down from the 50-day SMA ($0.11), indicating that the bears are selling on rallies.
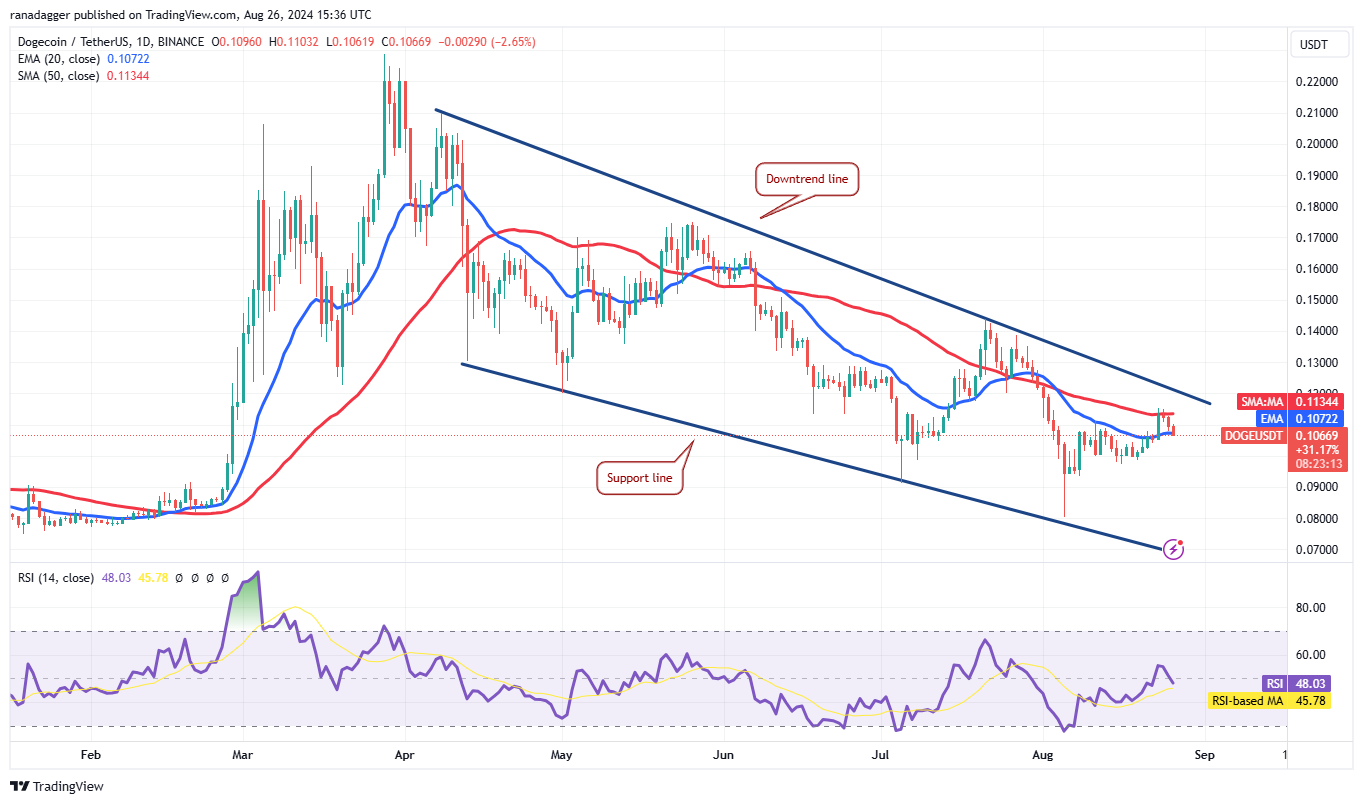
DOGE/USDT daily chart. Source: TradingView
Buyers will have to defend the 20-day EMA ($0.11) to improve the prospects of a break above the downtrend line. A break and close above the falling wedge pattern will suggest a trend change. The DOGE/USDT pair may then start a new up move to $0.14 and later to $0.18.
Instead, if the price skids below the 20-day EMA, it will suggest that the pair may remain inside the wedge for some more time. The bears will try to sink the price to $0.09, which is expected to attract buyers.
Toncoin price analysis
Toncoin (TON) turned down and plunged below the support line of the symmetrical triangle pattern on Aug. 24, indicating that the bears have overpowered the bulls.
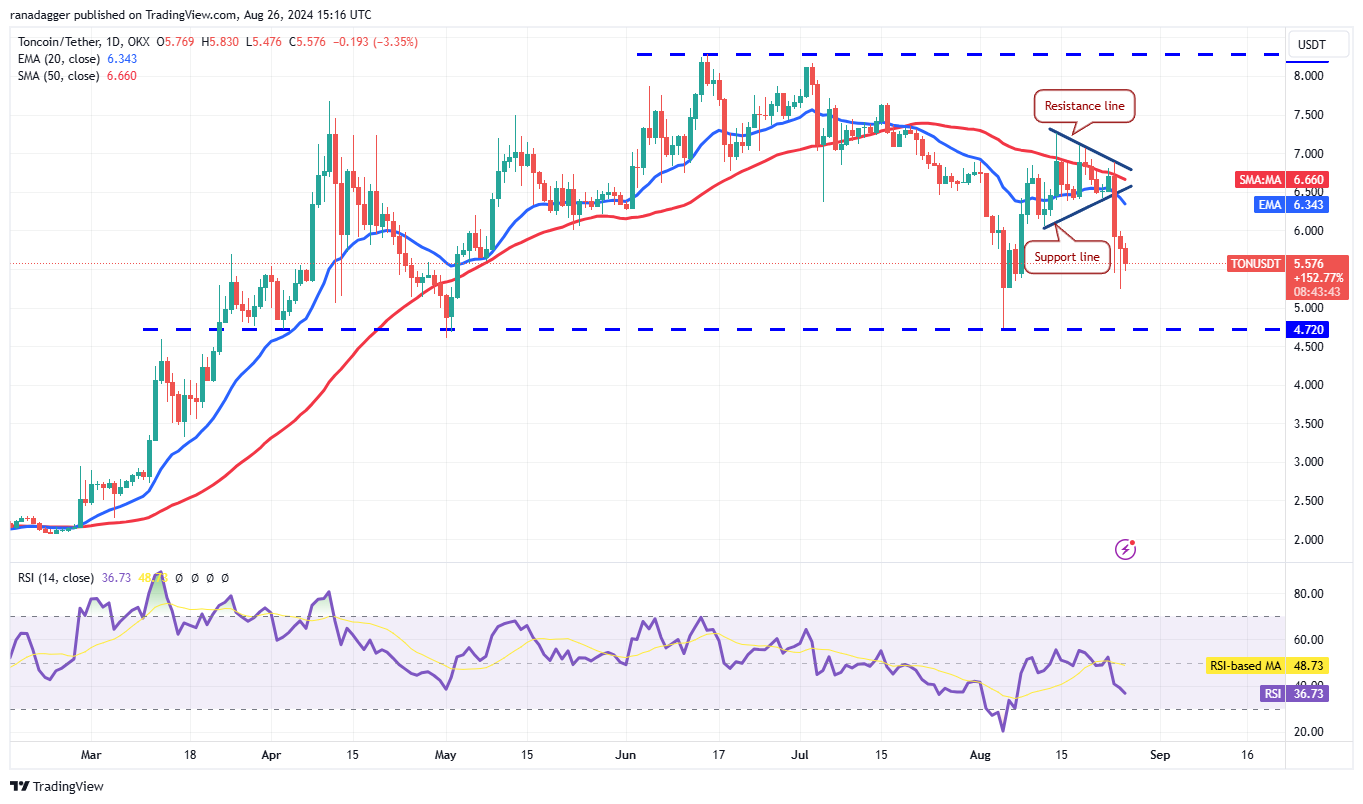
TON/USDT daily chart. Source: TradingView
The long tail on the Aug. 25 candlestick shows that the bulls attempted a bounce off the $5.25 support but failed to build upon it. The bears are again trying to sink the pair below $5.25. If they can pull it off, the TON/USDT pair may slump to $4.72. A close below $4.72 will complete a bearish head-and-shoulders pattern.
The first sign of strength will be a break and close above the 20-day EMA ($6.34). The pair may then climb to the 50-day SMA ($6.66).
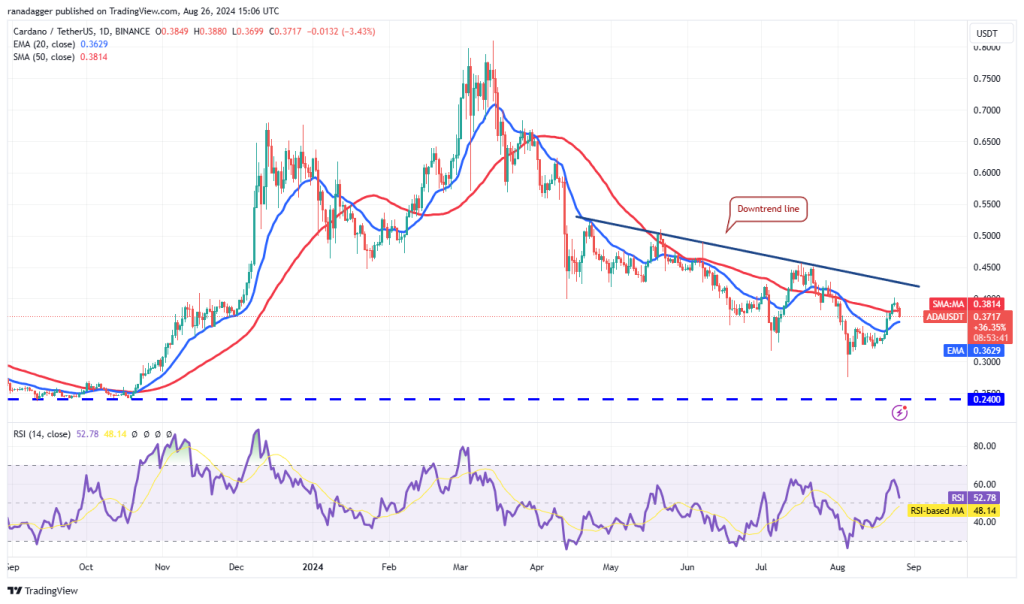
Cardano price analysis
Cardano (ADA) climbed above the 50-day SMA ($0.38) on Aug. 23, but the bulls could not push the price to the downtrend line.
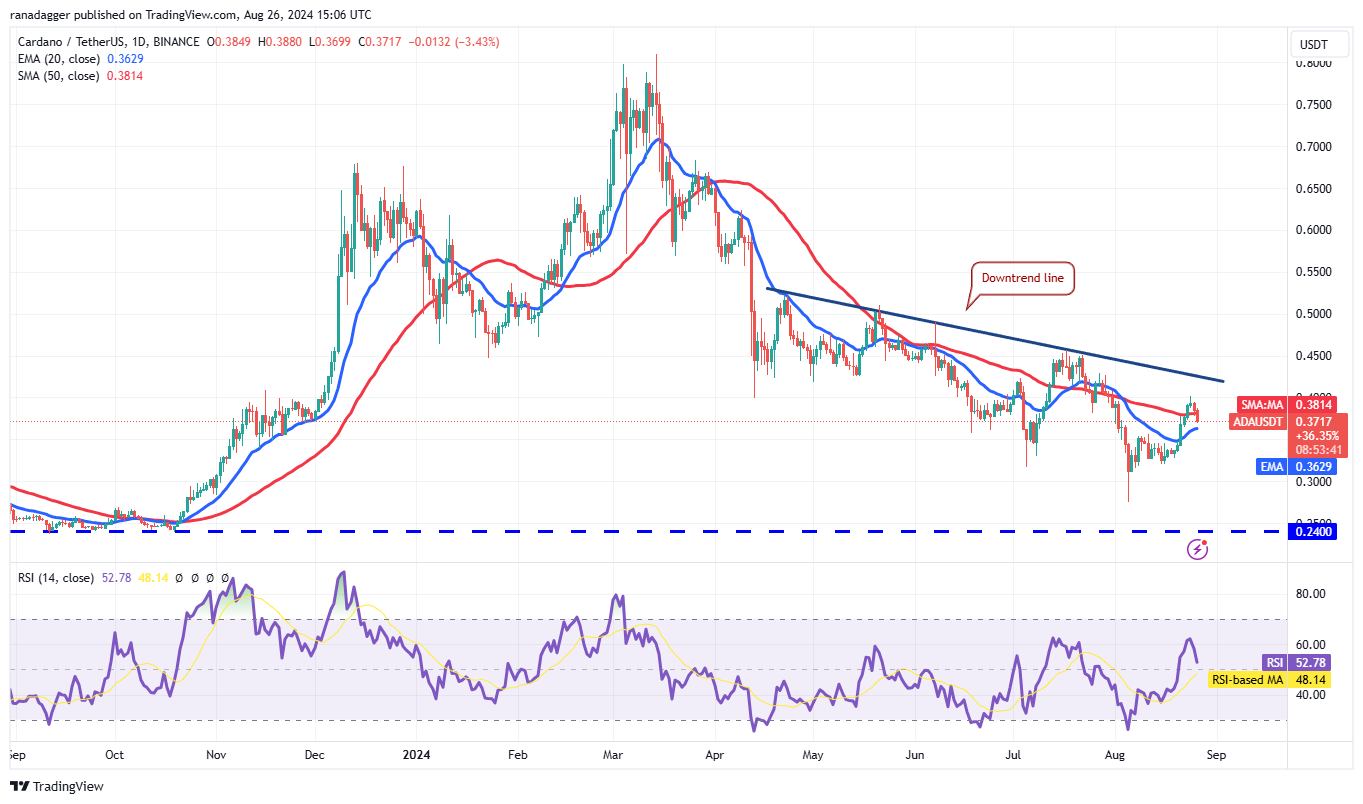
ADA/USDT daily chart. Source: TradingView
That may have tempted short-term traders to book profits, pulling the price below the 50-day SMA. The bulls will try to defend the 20-day EMA ($0.36) because a break below it may tug the ADA/USDT pair to $0.31.
If the price rebounds off the moving averages, it will suggest that the sentiment has turned positive and traders are buying on dips. That will increase the possibility of a break above the downtrend line.
This article does not contain investment advice or recommendations. Every investment and trading move involves risk, and readers should conduct their own research when making a decision.




Responses