Price analysis 5/13: SPX, DXY, BTC, ETH, BNB, SOL, XRP, TON, DOGE, ADA
Bitcoin’s strong rebound of the $60,000 level is encouraging but it still could be a hint that BTC’s range-bound action could continue for some time.

Traders prefer a trending market rather than a range-bound one. Sometimes, when there is uncertainty about the next directional move, traders step to the sidelines, and that seems to be the case with Bitcoin (BTC).
According to research firm Santiment, “fear and indecision” could be the factors that have led to a drop in Bitcoin’s on-chain activity toward historic lows. The firm clarified that it does not necessarily mean that Bitcoin will fall more.
Bitcoin’s consolidation is giving opportunities to investors to load up on Bitcoin. Japanese investment firm Metaplanet said it had made a “strategic shift” in its treasury management strategy to follow a Bitcoin-only approach in response to a sustained decline in the Japanese yen. Metaplanet announced a purchase of 117.7 Bitcoin at an average price of $65,000.
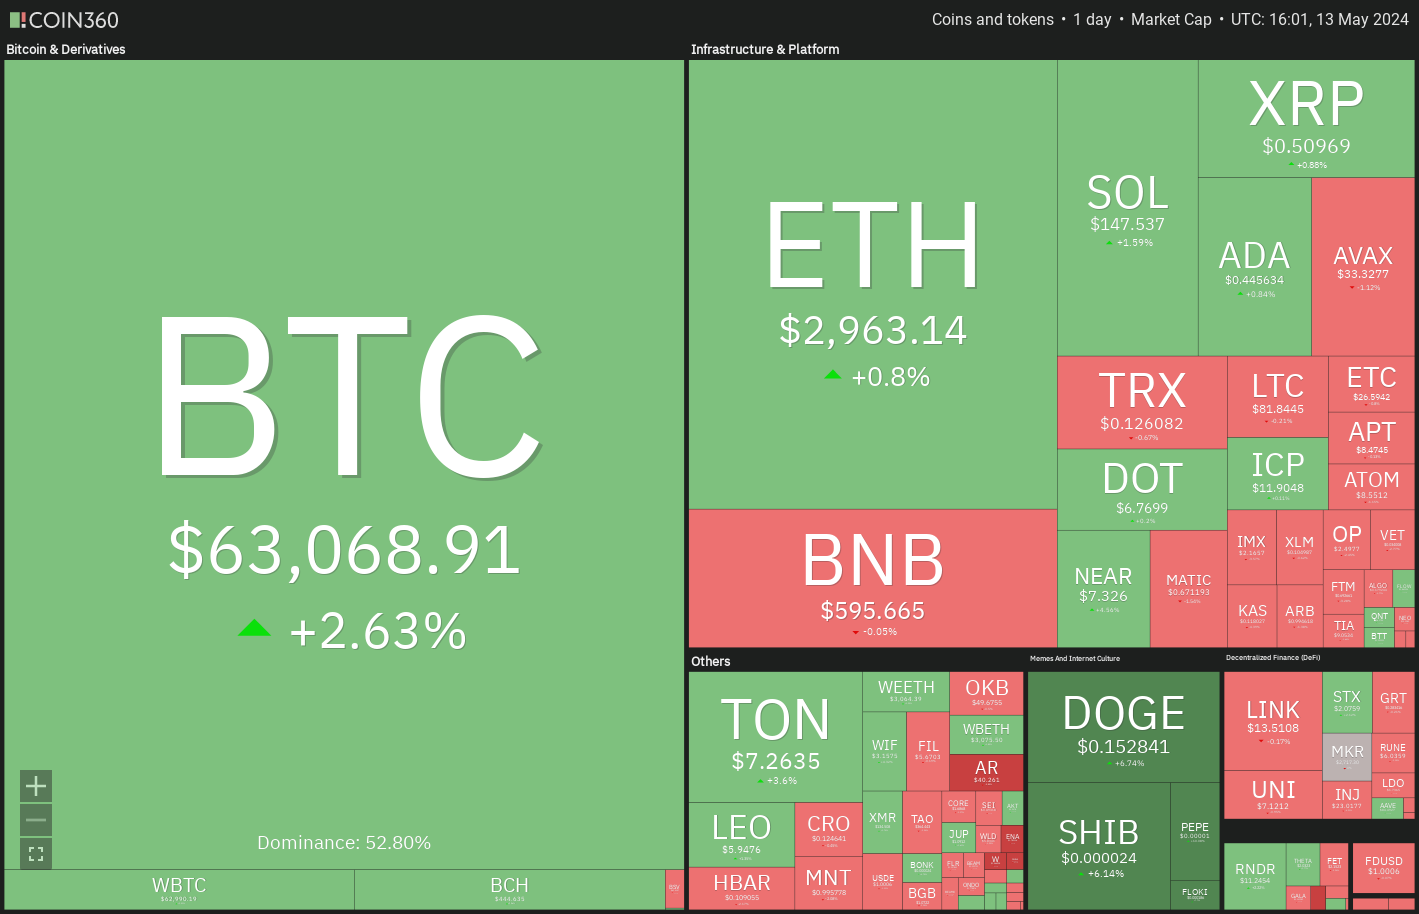
Generally, a consolidation near a lifetime high is a positive sign as it shows that traders are holding onto their positions as they anticipate the uptrend to continue. However, even after repeated attempts, if the overhead resistance is not crossed, traders may dump their positions, starting a sharp pullback.
Will bulls defend the essential support levels in Bitcoin and select altcoins? Let’s analyze the charts to find out.
S&P 500 Index price analysis
The S&P 500 Index has continued its northward march toward the all-time high, indicating demand from the bulls.
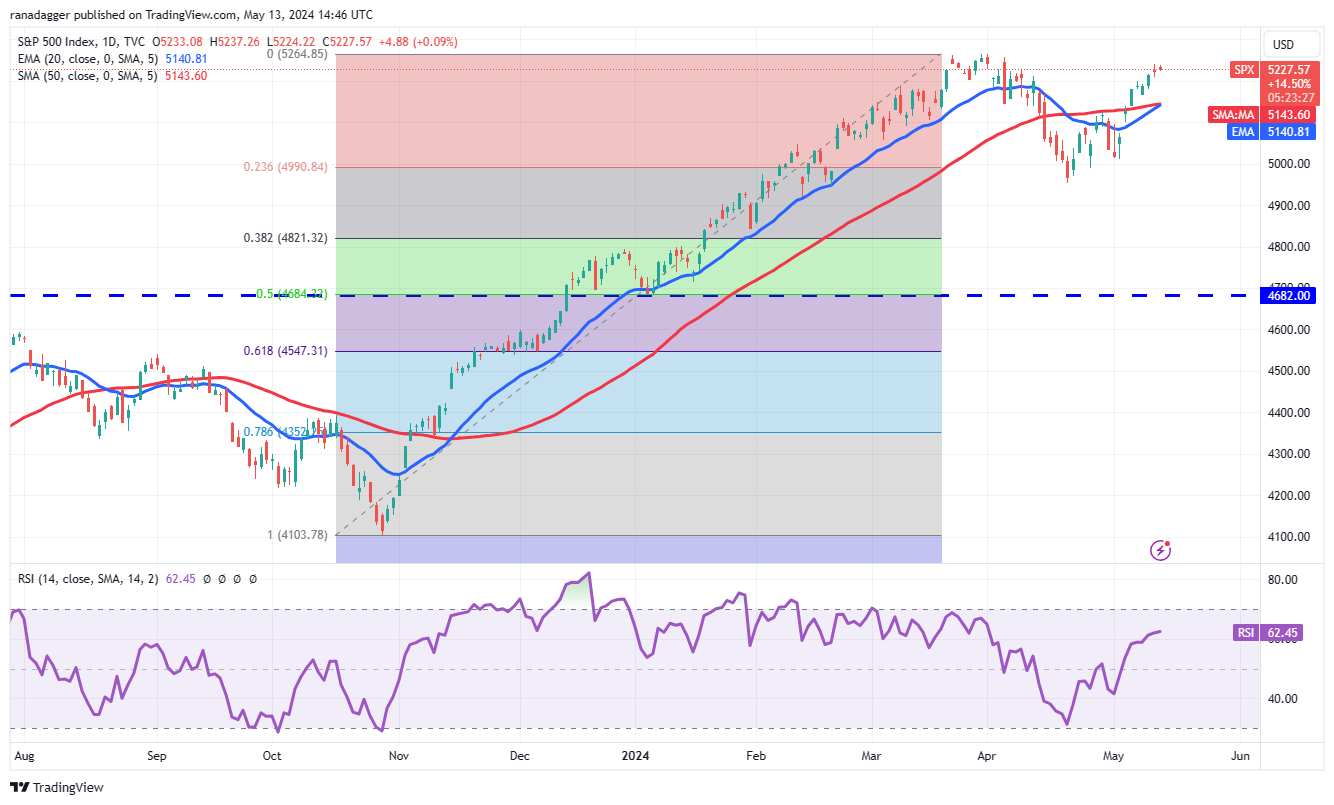
The 20-day exponential moving average (5,140) has started to slope up, and the relative strength index (RSI) has jumped into the positive territory, indicating a slight advantage to the buyers. If the 5,265 level is taken out, the index may travel toward 5,500.
However, the bears are unlikely to give up easily. They will attempt to stall the up move at 5,265. If the price turns down from this level, the index may stay range-bound between 5,265 and 4,950 for a while.
U.S. Dollar Index price analysis
The U.S. Dollar Index (DXY) broke below the 20-day EMA (105) on May 9, indicating aggressive selling by the bears on every minor rally.
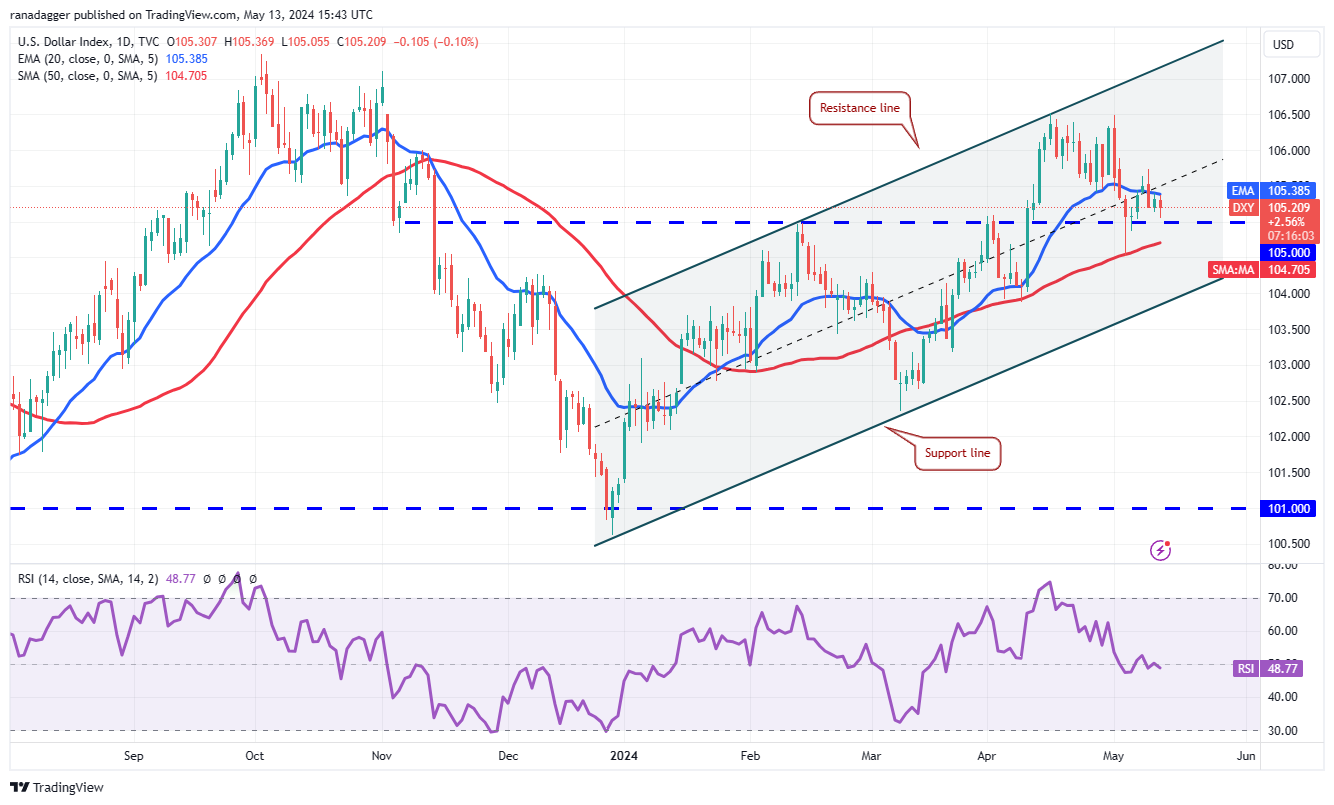
The bears will try to sink the price to the 50-day simple moving average (104), which could again act as a strong support. If the price bounces off the 50-day SMA, the index may again attempt to rise above the 20-day EMA. If that happens, the index could rally to 106.50.
Alternatively, if the price continues lower and breaks below the 50-day SMA, it will suggest that the bears are in charge. The index may slump to the support line, which is likely to attract strong buying from the bulls.
Bitcoin price analysis
The bulls are struggling to sustain Bitcoin above the 20-day EMA ($62,671), indicating that the bears are maintaining the pressure.
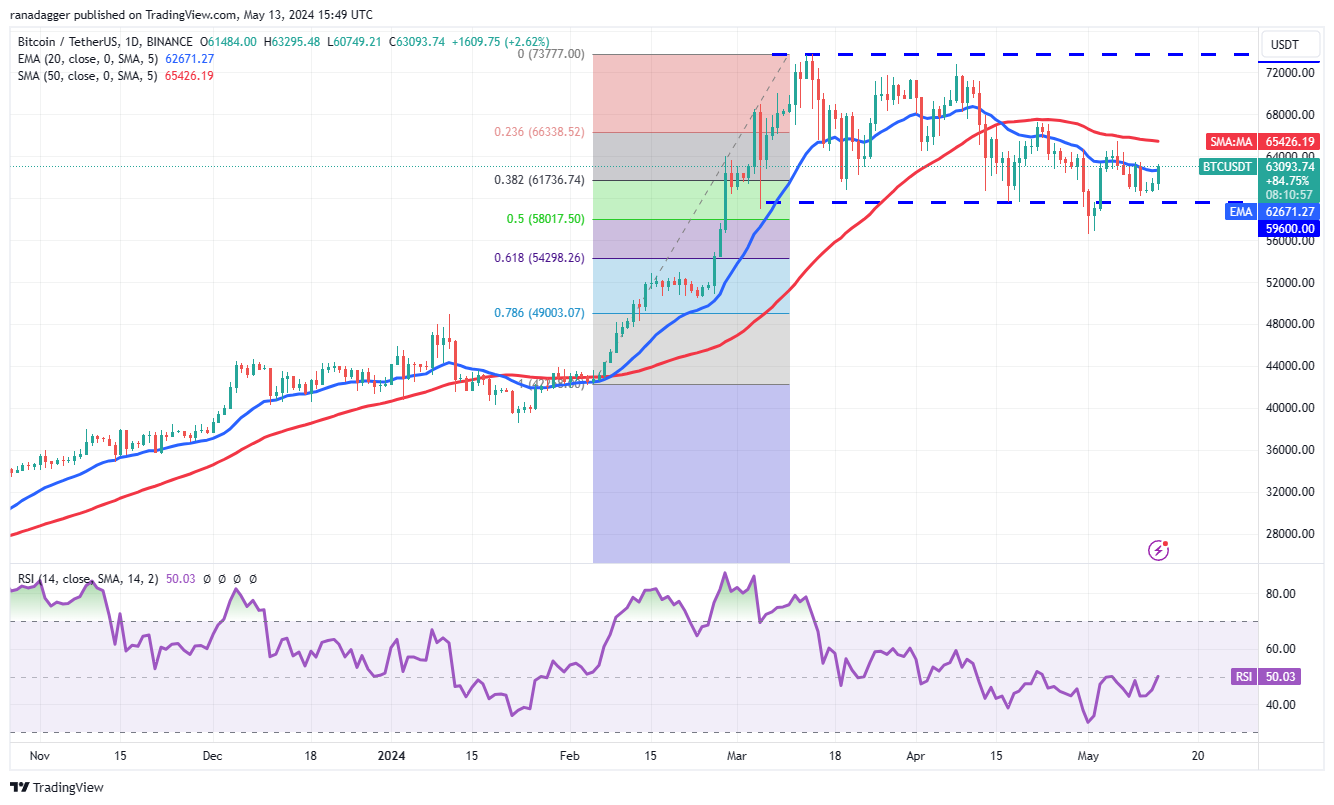
The flattish 20-day EMA and the RSI near the midpoint suggest the range-bound action may extend for a few more days. If buyers maintain the price above the 20-day EMA, the BTC/USDT pair could rise to the 50-day SMA ($65,426). This level may act as a stiff resistance, but if the bulls surpass it, the pair may climb to $73,777.
Contrary to this assumption, if the price turns down from the 50-day SMA, it will indicate that bears are active at higher levels. The pair may then slump to the critical support zone between $59,600 and $56,500.
Ether price analysis
Ether (ETH) continues to trade inside the descending channel pattern, indicating that the bears are in control.
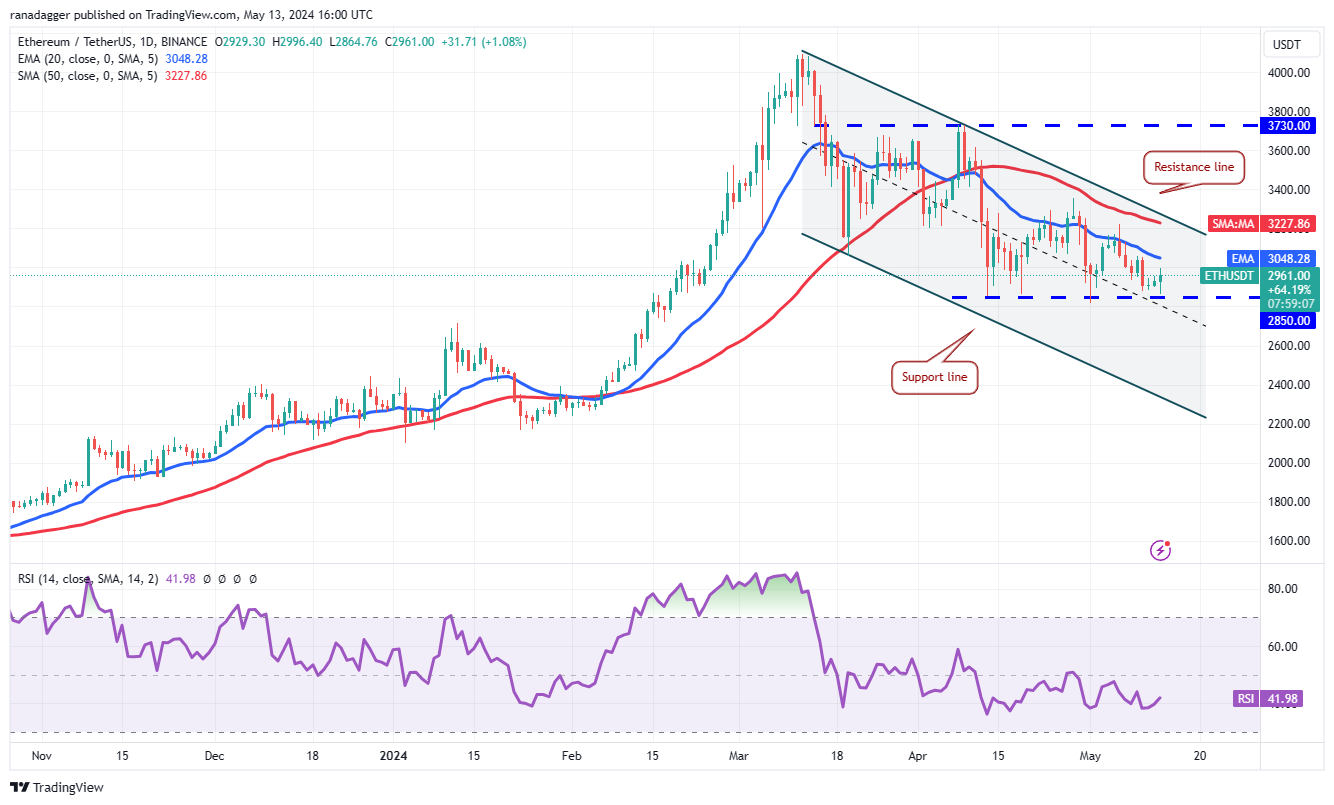
The price is attempting to bounce off $2,850, an important level for the bulls to defend. If this level breaks down, the ETH/USDT pair could start the next leg of the downtrend to the channel’s support line.
Time is running out for the bulls. If they want to make a comeback, they will have to start a recovery and drive the price above the resistance line. The pair may then rise to $3,357 and later to $3,730.
BNB price analysis
BNB (BNB) has been trading between the downtrend line and the moving averages, indicating indecision between the bulls and the bears.
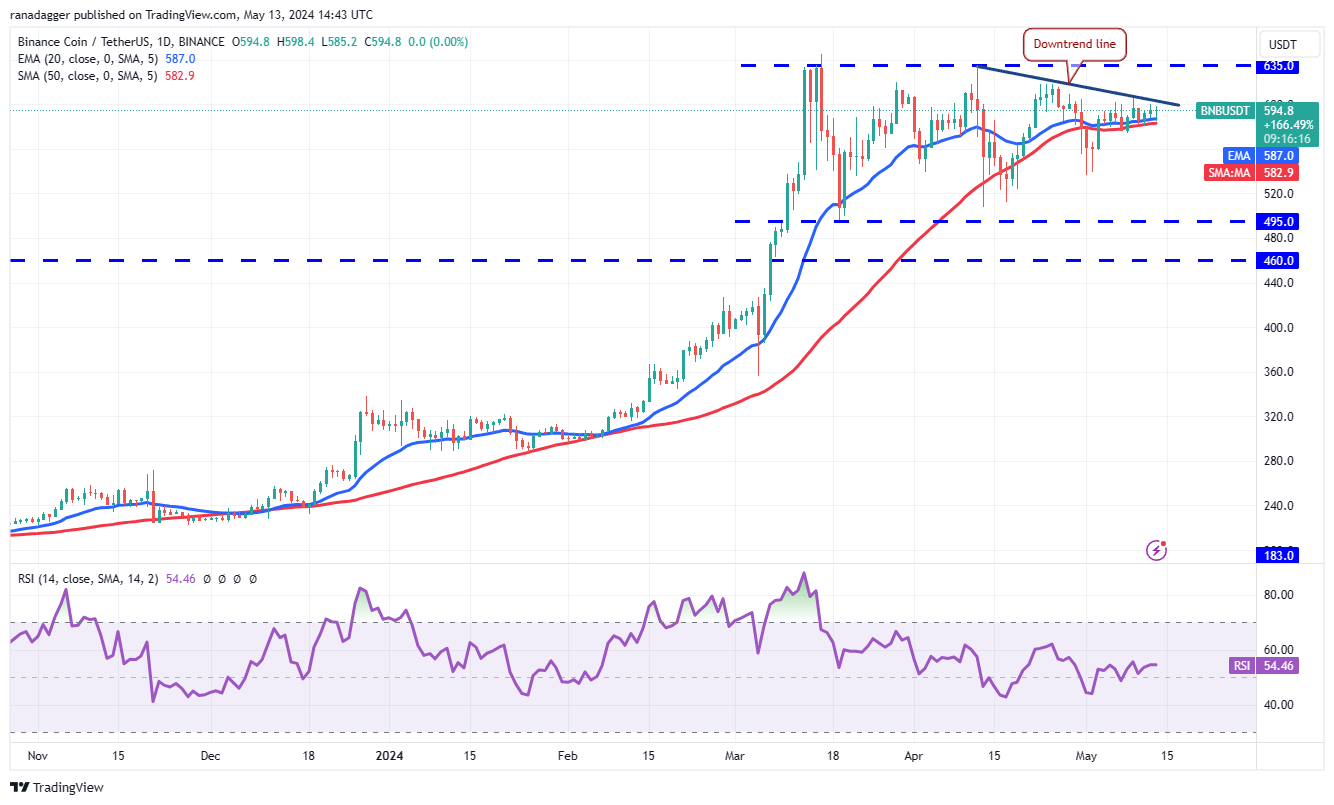
If the price skids below the moving averages, the short-term advantage will tilt in favor of the bears. The BNB/USDT pair could move downward to $536 and later to the crucial support at $495.
Contrarily, if the price turns up and breaks above the downtrend line, it will suggest that the bulls have the upper hand. The buyers will attempt to push the price above $635 and resume the uptrend.
Solana price analysis
Solana (SOL) broke below the $140 support on May 13, but the bears could not pull the price to the pivotal support at $126.
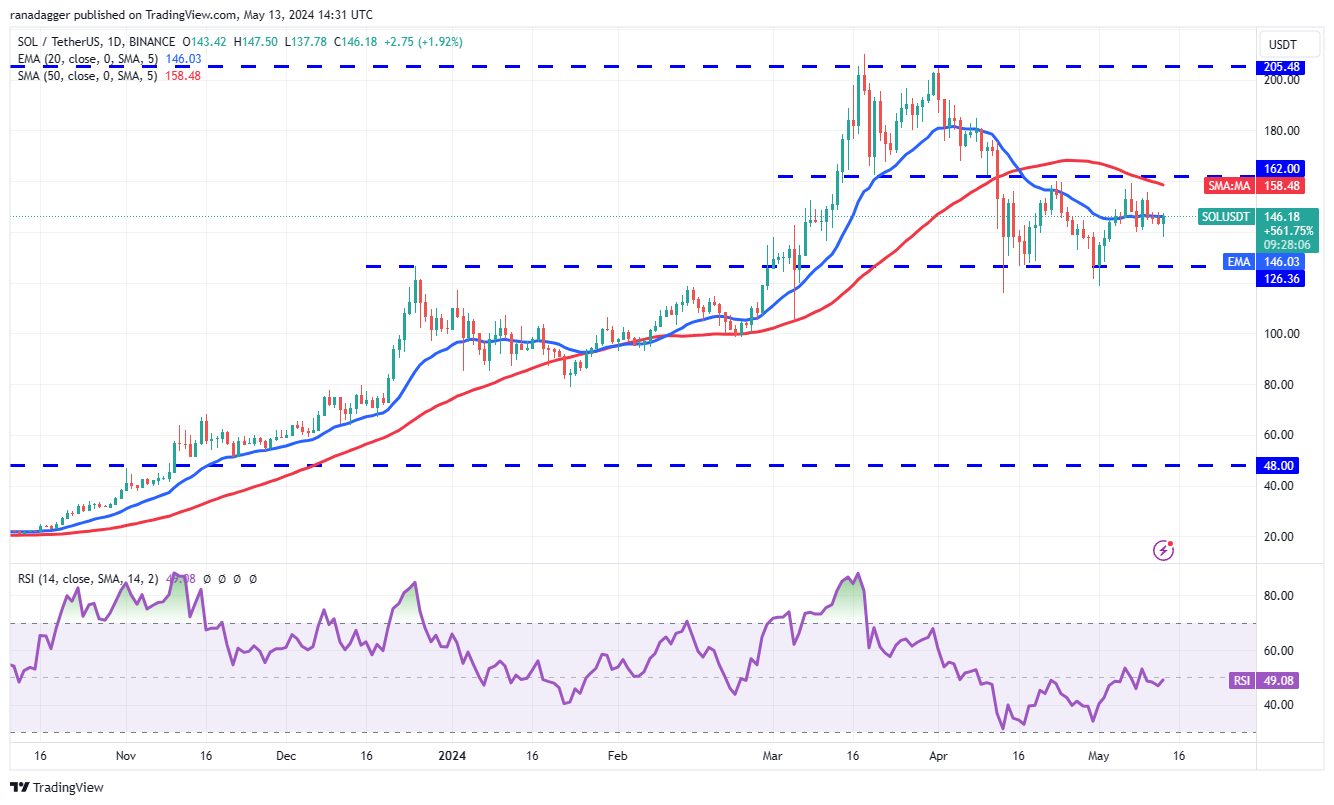
The flattish 20-day EMA ($146) and the RSI near the midpoint do not give a clear advantage either to the bulls or the bears. If the price turns up and rises above the 20-day EMA, it will suggest solid buying at lower levels. The pair may reach the stiff resistance at $162.
Instead, if the price turns down from the 20-day EMA and breaks below $137, it will signal that bears are trying to take charge. The SOL/USDT pair could descend to $126, which is when the bulls are expected to start buying.
XRP price analysis
XRP (XRP) has been trading below the 20-day EMA ($0.52), but the bears have failed to sink the price to the essential support at $0.46.
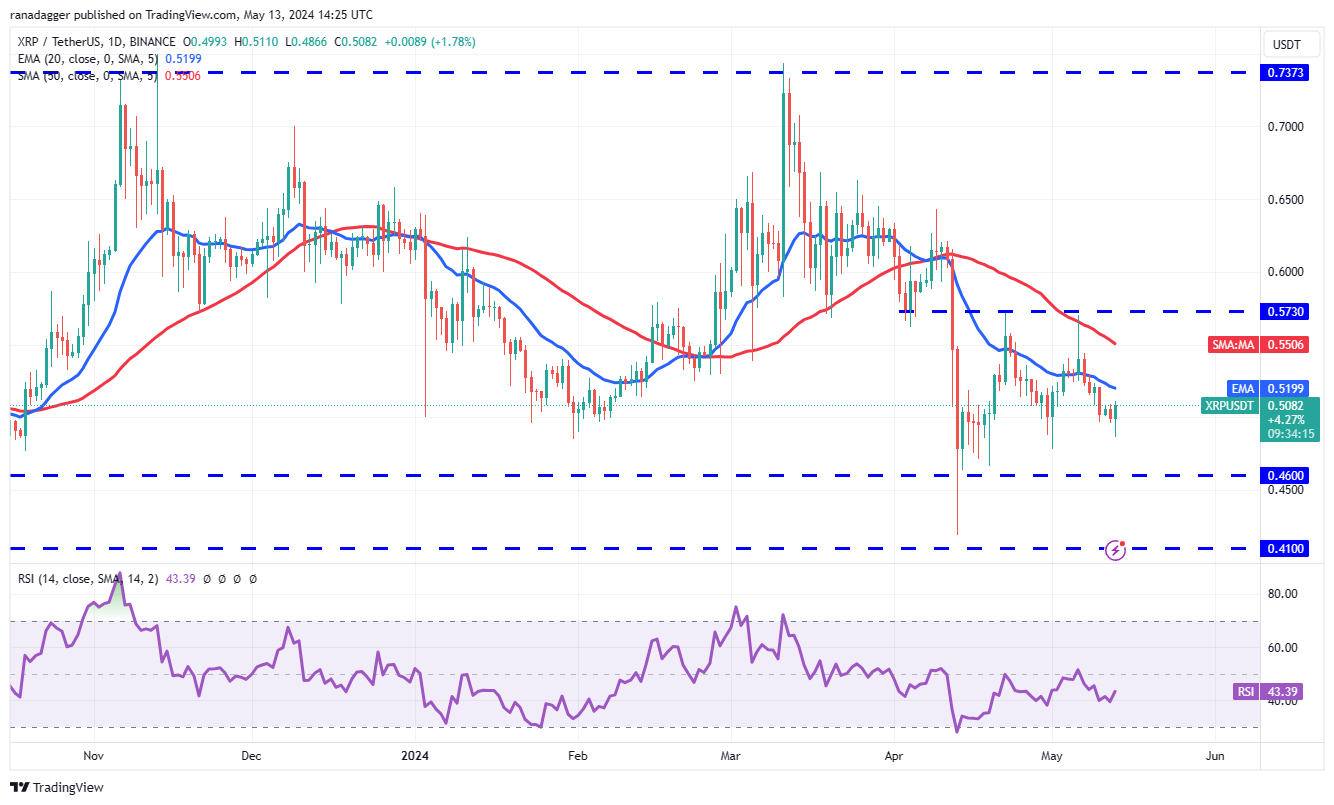
The downsloping 20-day EMA and the RSI near 43 suggest that the bears have the edge. Any recovery attempt is likely to face selling at the 20-day EMA. If the price turns down from the 20-day EMA, the XRP/USDT pair could dive to $0.46. Buyers are expected to fiercely defend this level.
If the price rebounds off $0.46 with strength and rises above the 20-day EMA, it will indicate that the pair may extend its range-bound action for some more time.
Related: Why is Bitcoin price up today?
Toncoin price analysis
Toncoin (TON) has been gradually moving higher toward the overhead resistance of $7.67, signaling demand from the bulls.
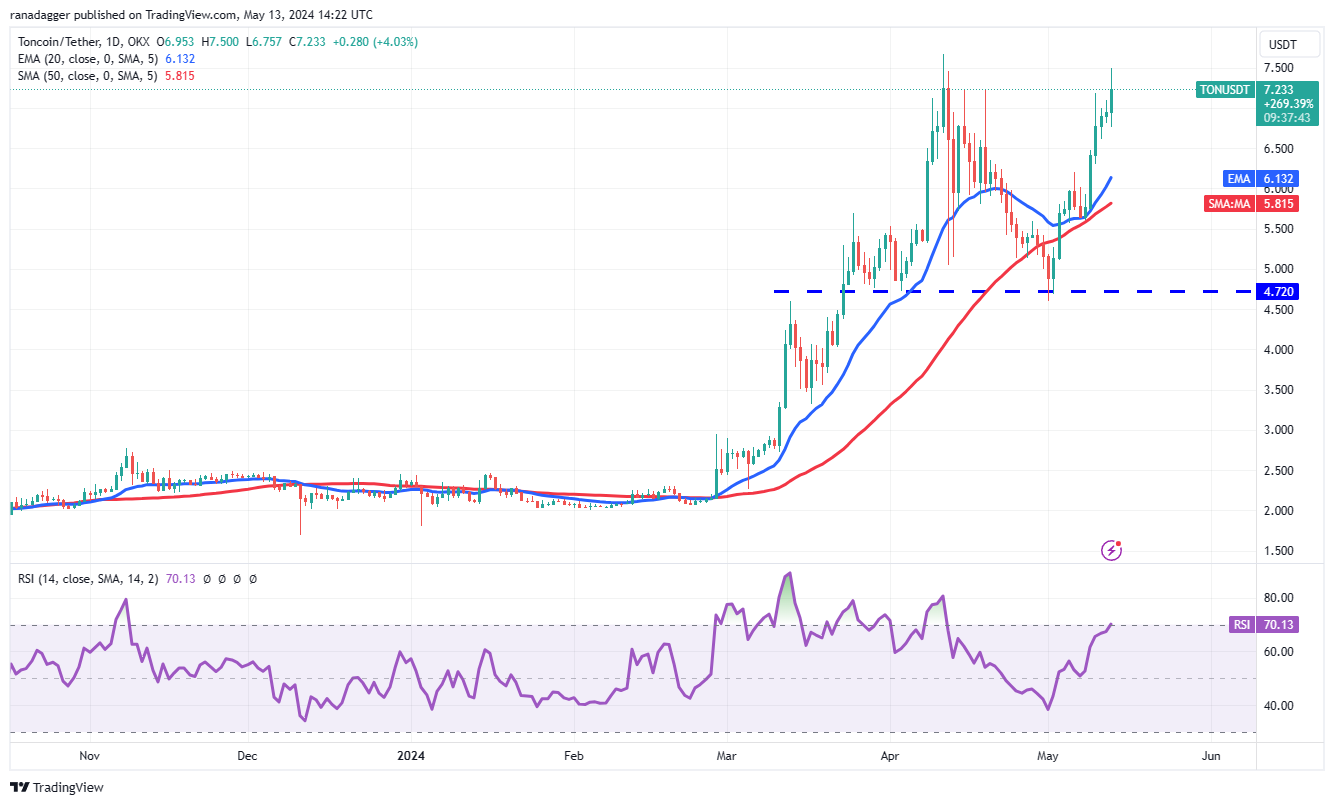
The bears are expected to pose a strong challenge at $7.67, but if the bulls do not give up much ground from this resistance, it will enhance the prospects of an upside breakout. The TON/USDT pair could then rally toward $9.
On the contrary, if the price turns down sharply from the overhead resistance, it will indicate that the bears are not willing to relent. The pair could then descend to the moving averages, which is likely to act as a strong support.
Dogecoin price analysis
Dogecoin (DOGE) has been consolidating between the 50-day SMA ($0.16) and the horizontal support at $0.12 for some time.
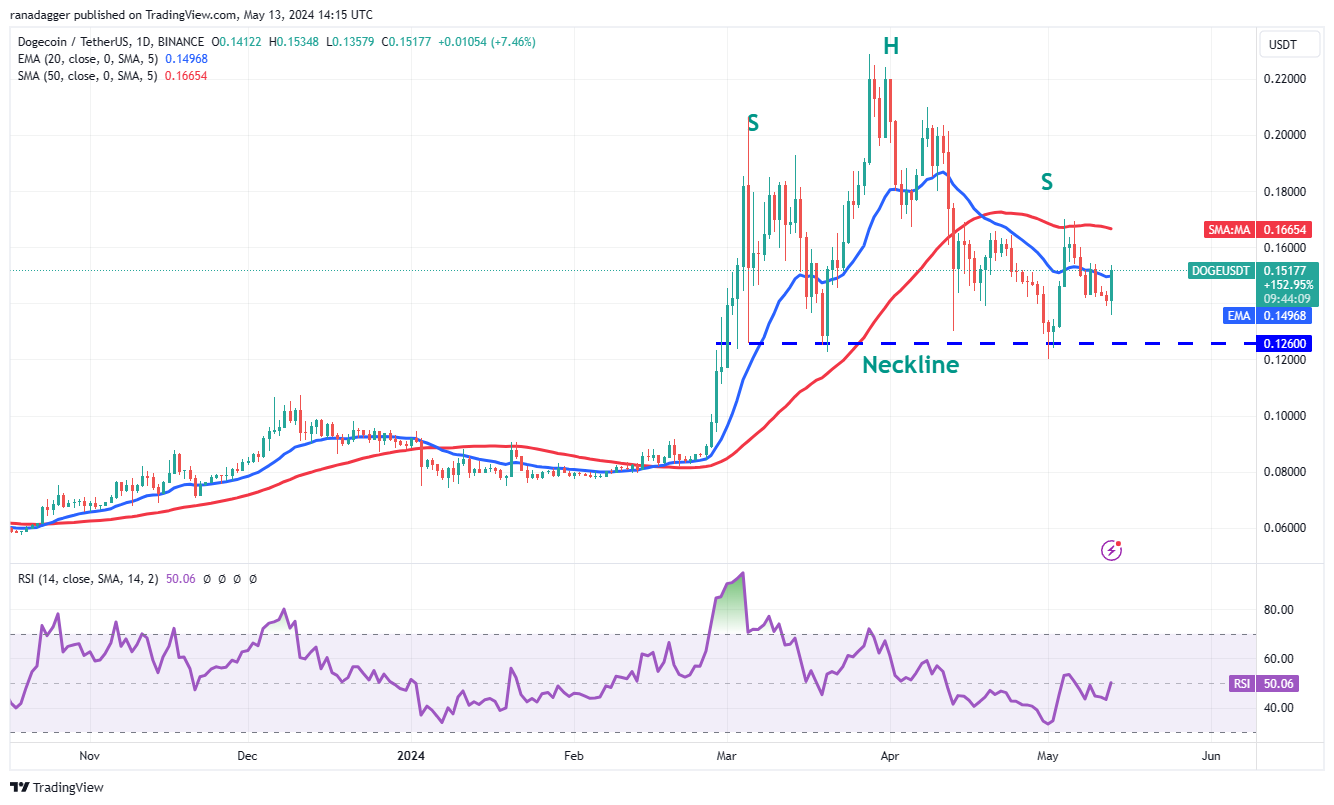
Buyers are trying to maintain the price above the 20-day EMA ($0.15). If they succeed, the DOGE/USDT pair could rise to the 50-day SMA. This is an important level for the bears to defend because a rally above it could open the doors for a rally to the overhead resistance zone between $0.21 and $0.23.
On the contrary, a break and close below $0.12 will complete a bearish head-and-shoulders pattern. The pair may then dive to the strong support at $0.08.
Cardano price analysis
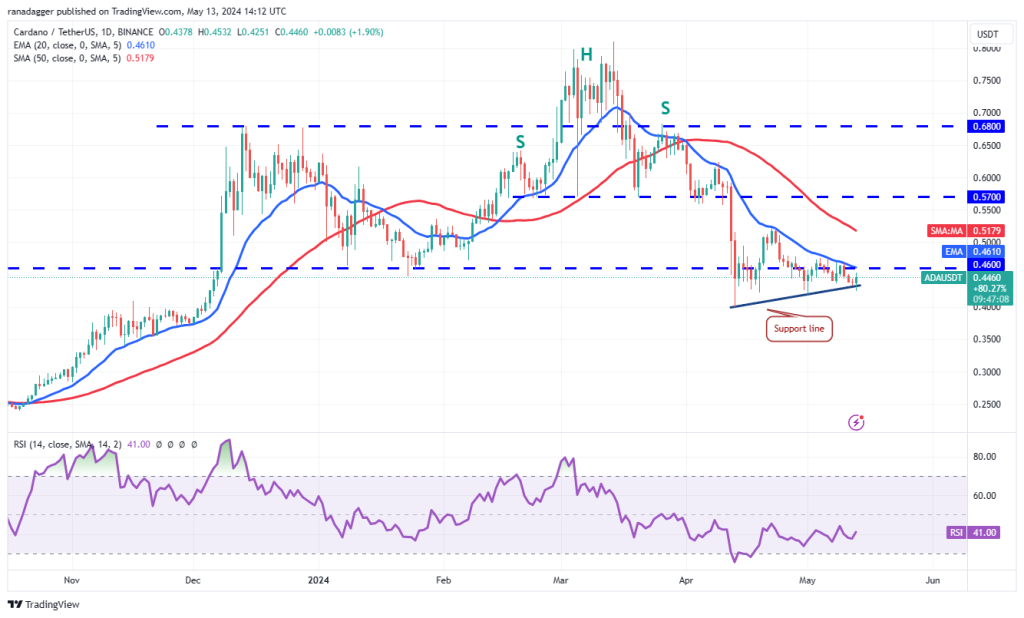
Cardano (ADA) bounced off the support line on May 13, an important short-term level for the bulls to guard.
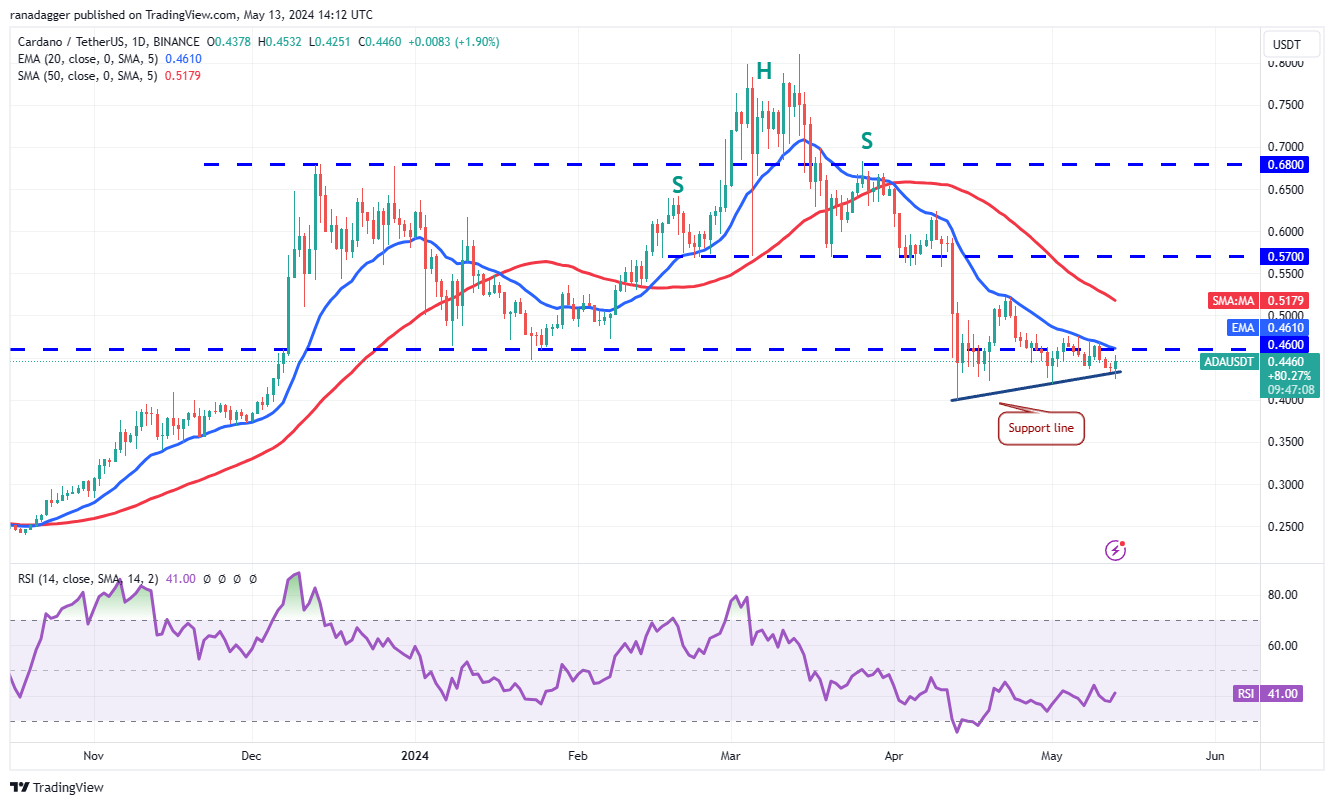
The downsloping 20-day EMA ($0.46) and the RSI in the negative zone suggest that the path of least resistance is to the downside. If the price breaks and maintains below the support line, the next stop could be $0.40.
Conversely, if the price continues higher and breaks above the 20-day EMA, it will indicate that bulls remain buyers on dips. The ADA/USDT pair may rise to the 50-day SMA ($0.52) and eventually to $0.57.




Responses