Did XRP price just bottom against Bitcoin?
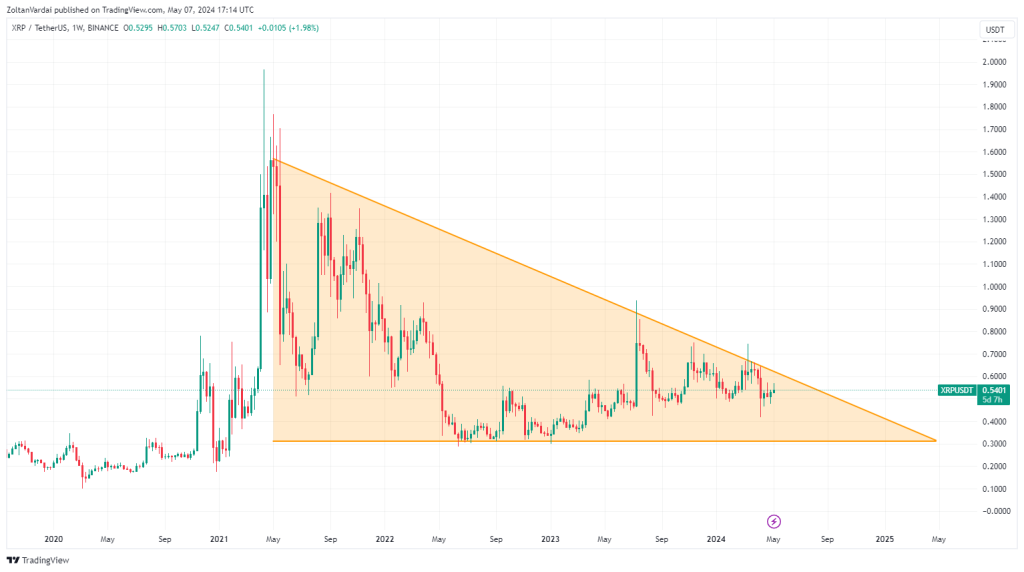
XRP price fell over 14% year-to-date pressured by Ripple’s ongoing legal battle with the SEC so a bounce is in order, analysis suggests.
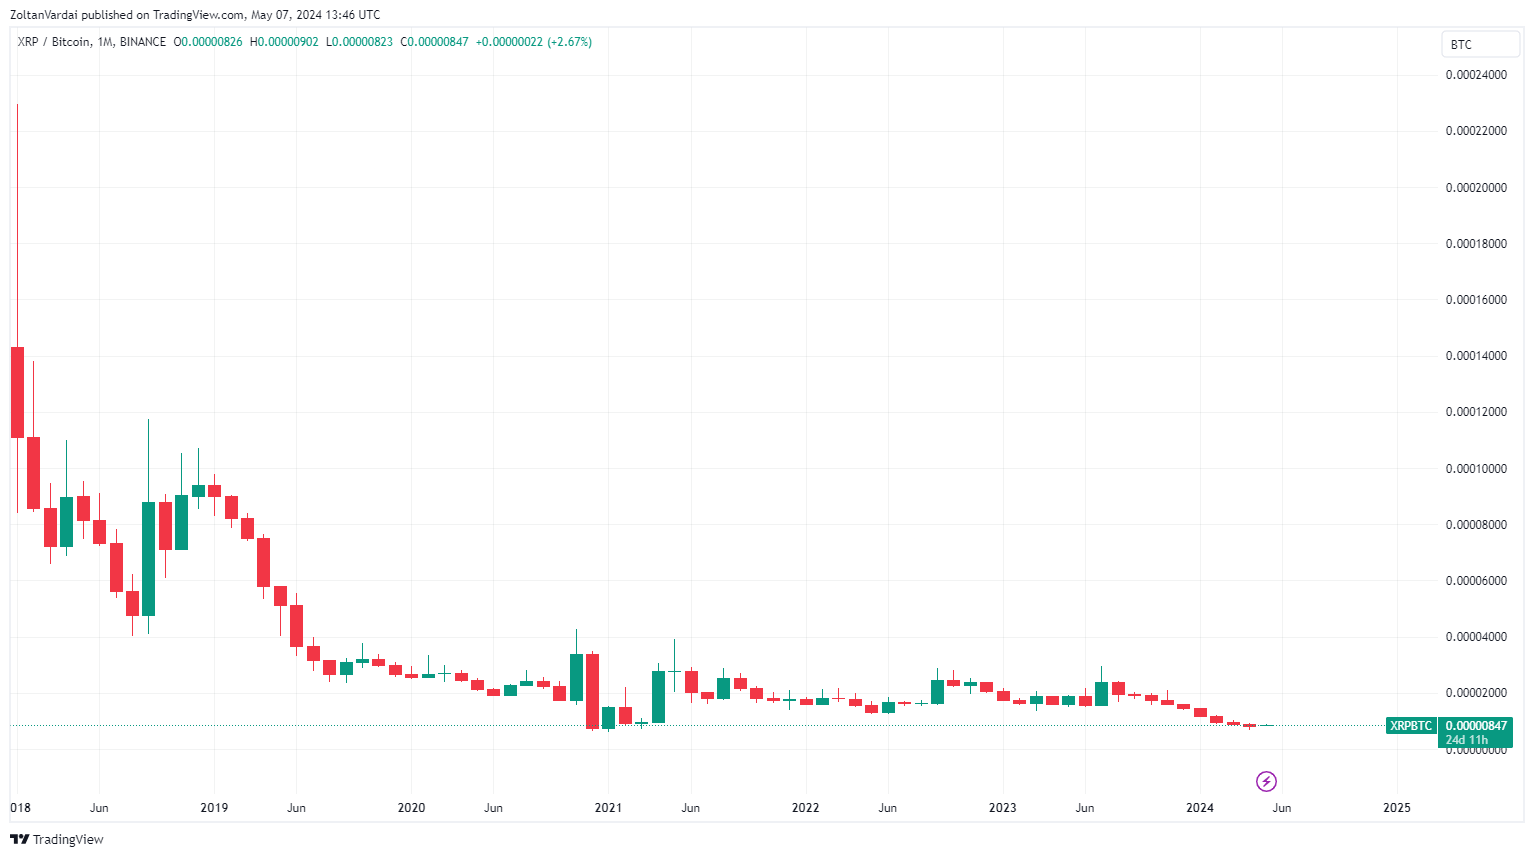
The price of XRP (XRP) in Bitcoin (BTC) terms sunk to a three-year low this week, suggesting a potential local bottom and buying opportunity for XRP.
XRP/BTC price ratio sinks to 2021 low
XRP’s price compared to Bitcoin fell to a three-year low last seen at the beginning of April 2021, according to TradingView data.
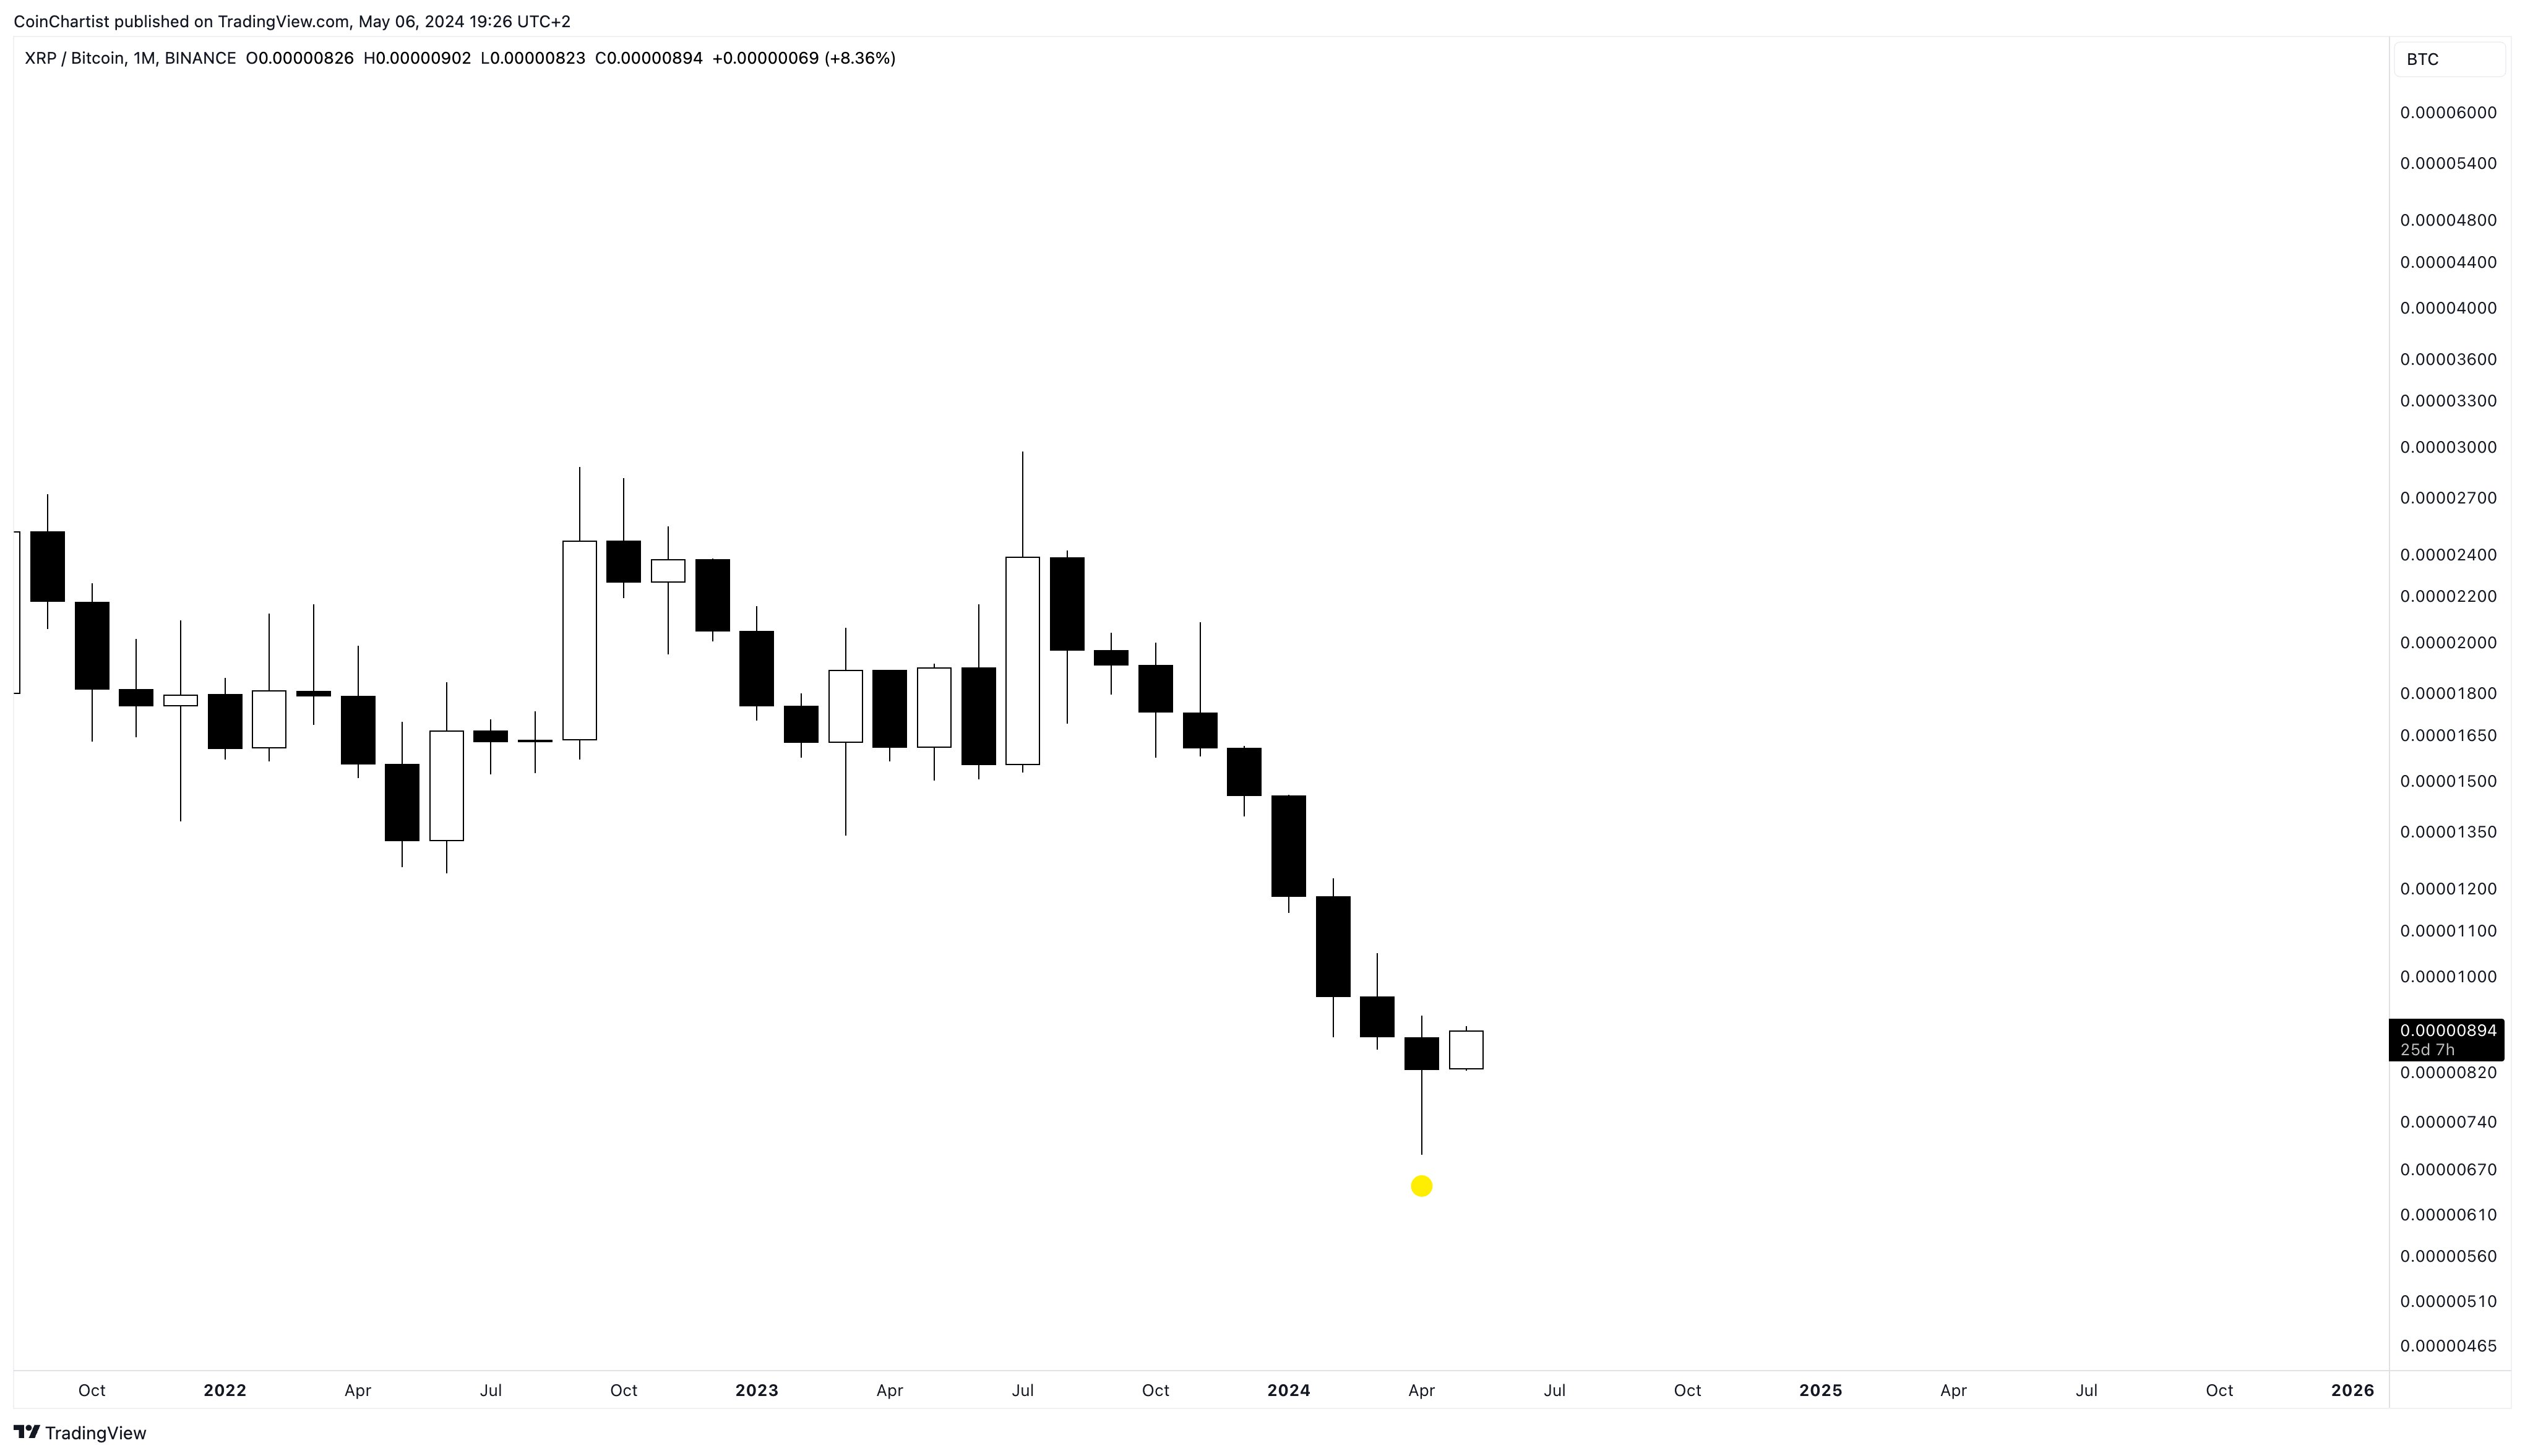
On the monthly chart, this chart pattern could be interpreted as a strong signal of a XRP/BTC bottom, according to Tony Severino, the founder of CoinChartist, who wrote in a May 6 X post:
“Great spot – he’s right. XRP/BTC just flashed a bullseye bottom signal.”
Despite the optimistic chart formation, XRP/USD has been in a downtrend since the beginning of 2024. XRP price fell over 14% year-to-date (YTD) to the current $0.53 mark, while BTC/USD rose over 43%.
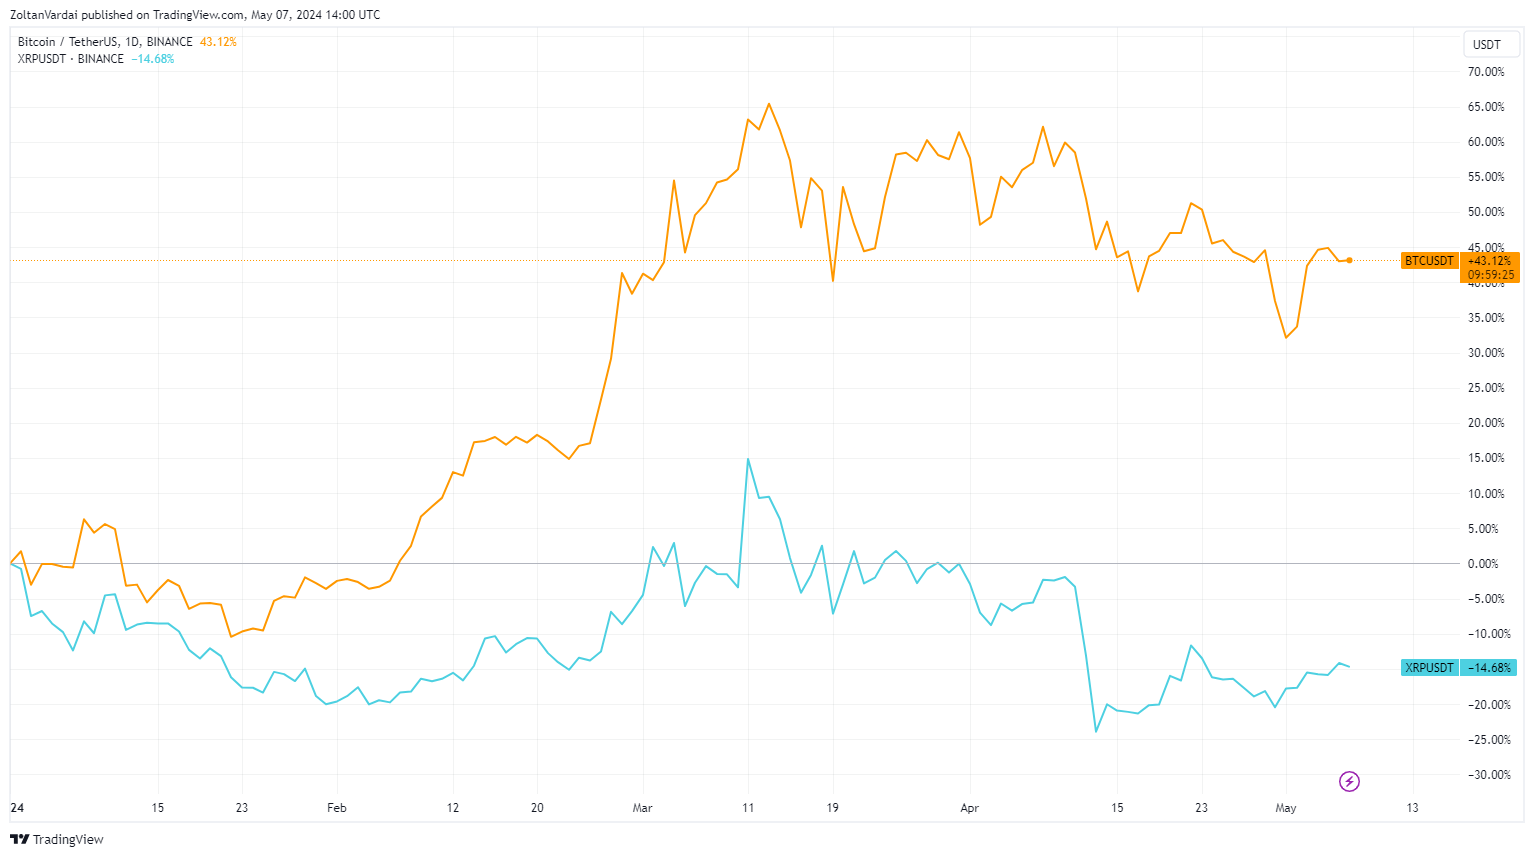
XRP’s crabwalk can largely be attributed to Ripple’s ongoing lawsuit with the U.S. Securities and Exchange Commission (SEC), according to Iva Wisher, COO & Co-founder of Prom and previous chief analyst at 3commas. Wisher told Cointelegraph:
“XRP’s price movement is tied to the uncertainty generated by its legal battle with the SEC. Such obstacles naturally lead to cautious investor sentiment and reduced trading activity.”
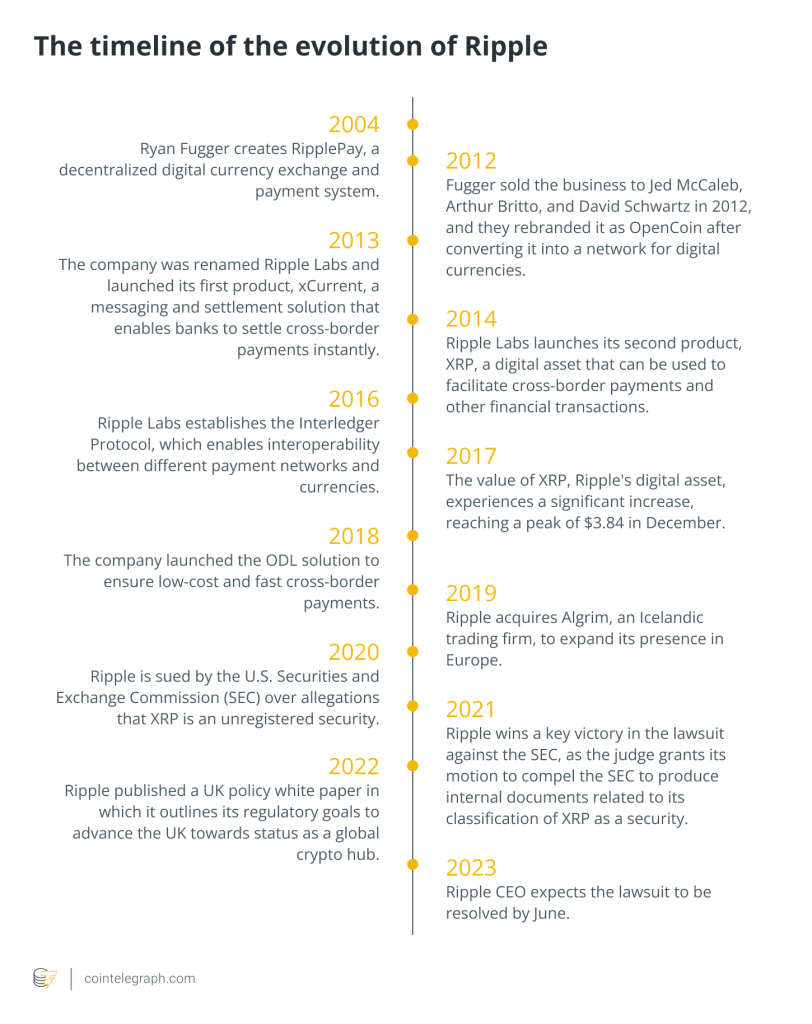
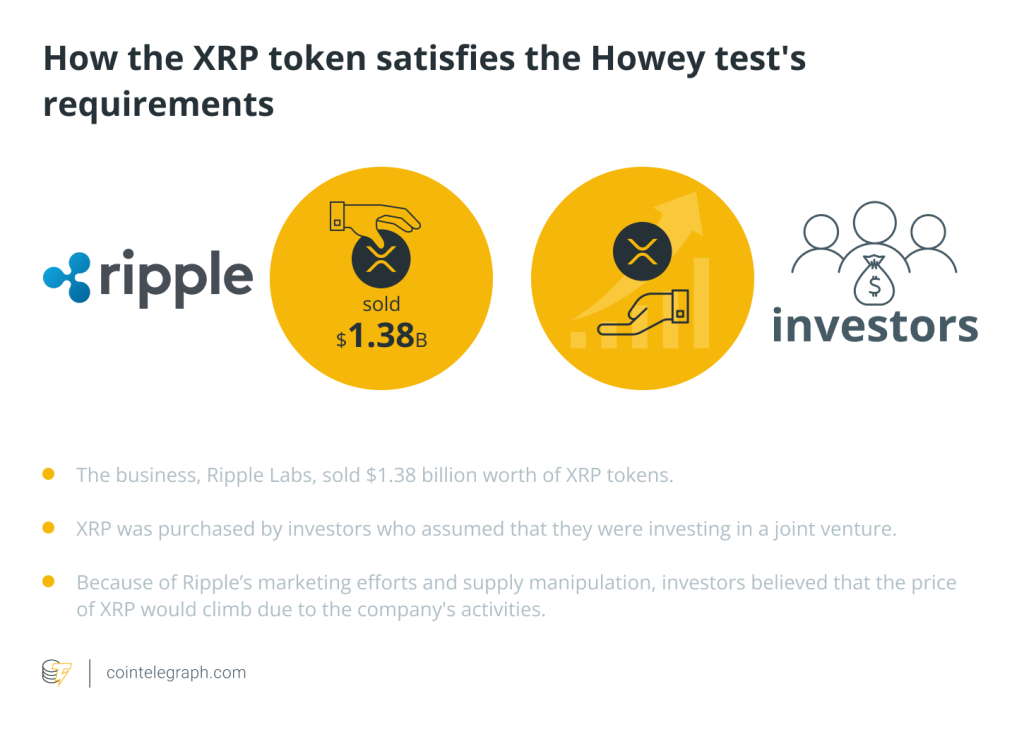
The SEC sued Ripple back in 2020 accusing them of illegally raising $1.3 billion through an alleged unregistered securities offering by selling XRP.
In the latest development, Ripple contested the SEC’s request to impose a $2 billion fine against the blockchain company, saying the penalty should not exceed $10 million.
Related: Bitcoin enters ‘new era’ as whales scoop up over 47K BTC during price pullback
Is the XRP local bottom in?
Despite XRP’s subdued price action, it could rise to a new all-time high by July, according to pseudonymous crypto analyst Charting Guy, who wrote in a May 6 X post:
“Fractal projected target is 0.00006486. With today’s BTC price, that puts us at a roughly $4.09 XRP. As I’ve been saying forever, new all-time high by July. Now say $BTC is at $85,000 -$100,000 at that time like I think it’ll be. Then we’re talking a $5.51 – $6.48 XRP.”
On the daily chart, XRP’s relative strength index (RSI) indicator stood at 50, suggesting that XRP’s price is currently neutral or at fair value, up from the 28 low on April 13, when XRP price was oversold.
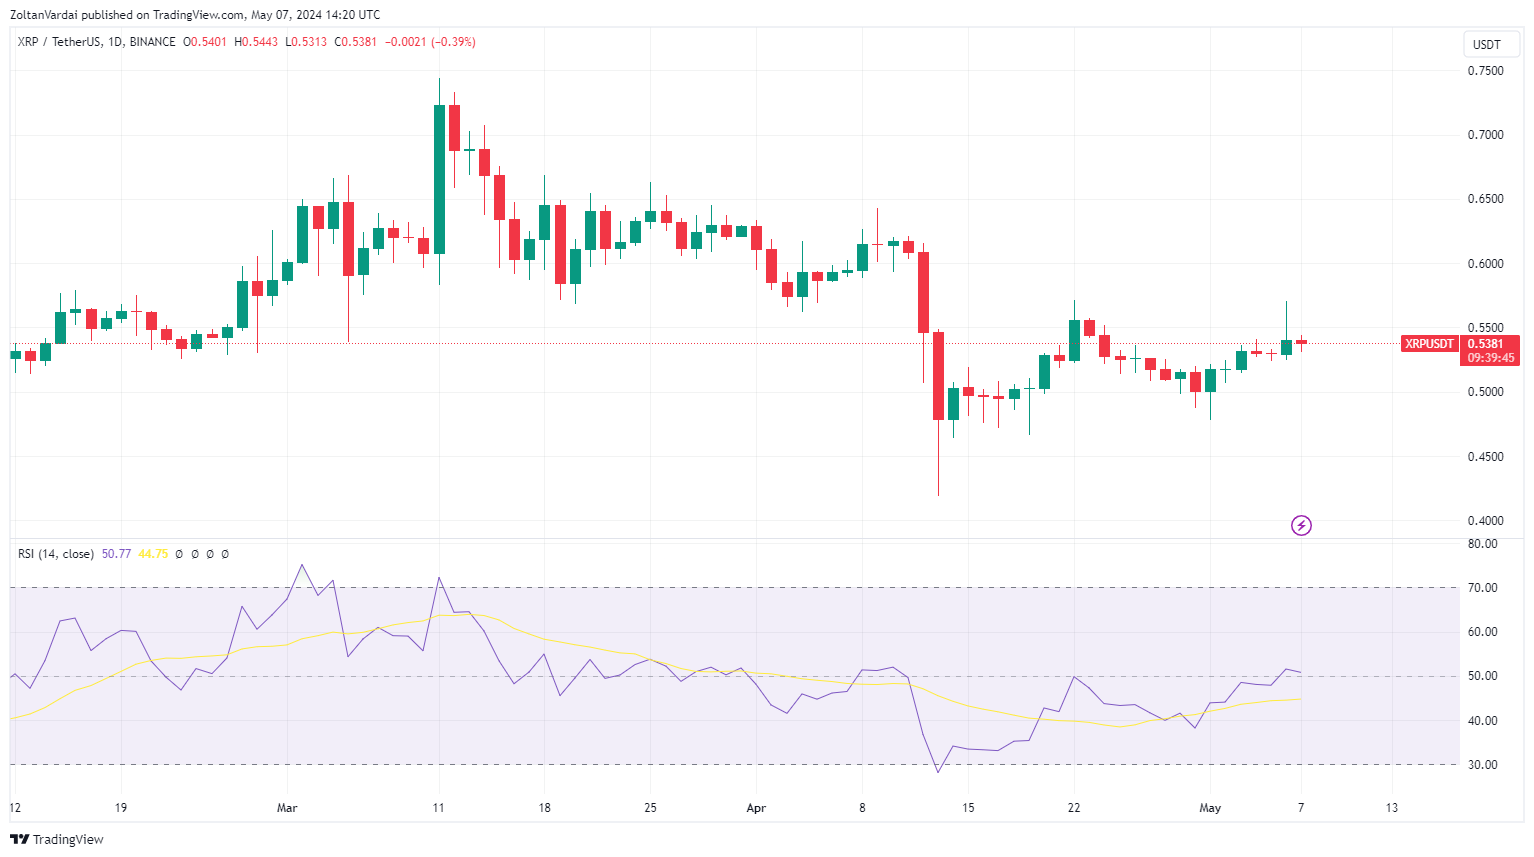
The RSI is a popular momentum indicator used to measure whether an asset is oversold or overbought based on the magnitude of recent price changes.
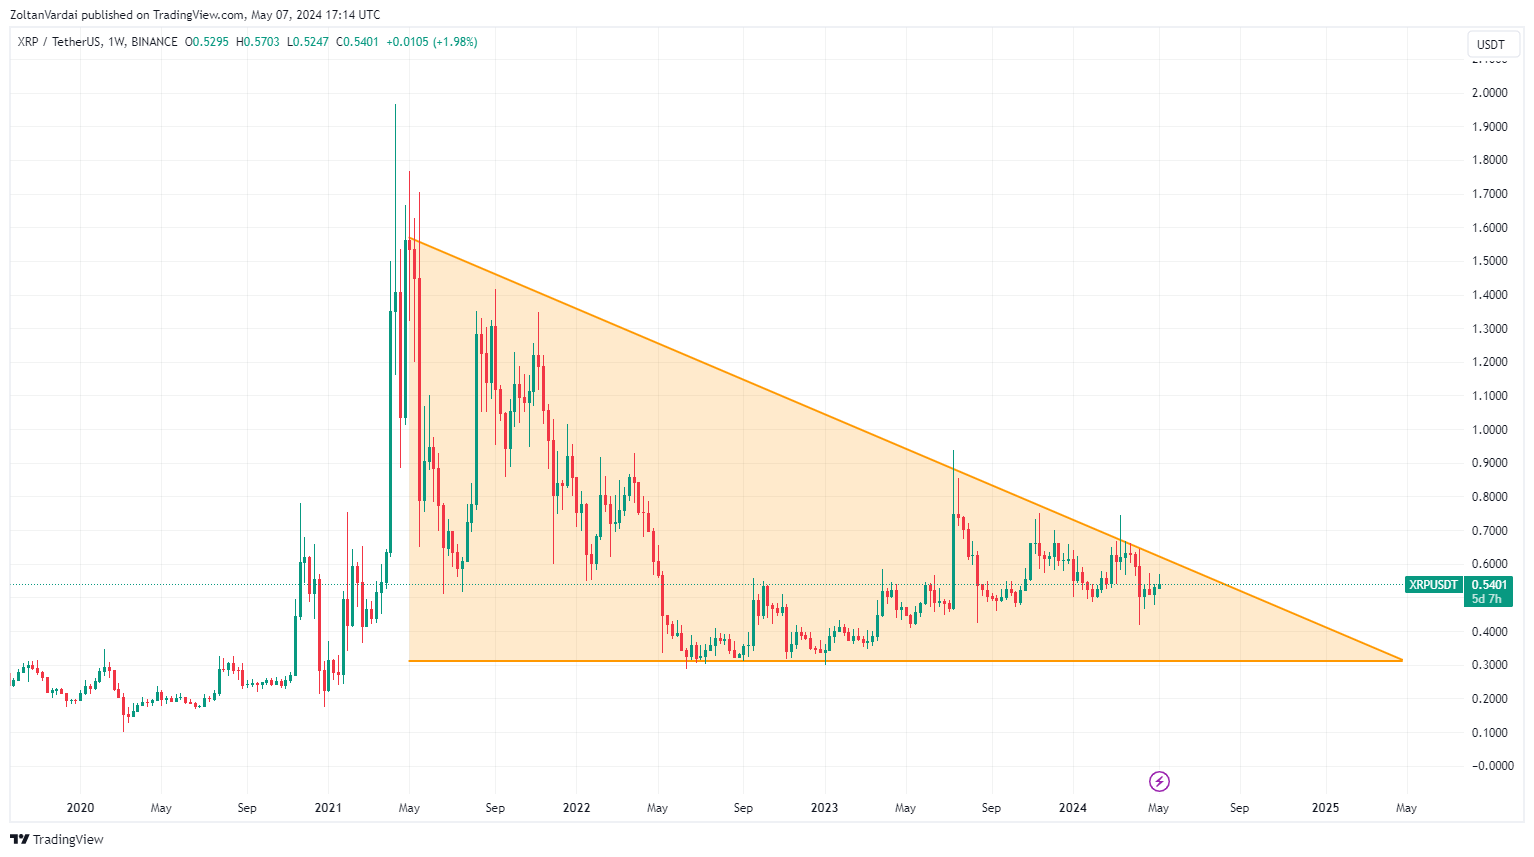
However, XRP price has been in a downtrend for over three years. On the weekly chart, XRP has been printing lower highs since April 2021. If this trend persists, charts suggest that the XRP price could fall back to the $0.31 level, which was a significant support area through 2022 and 2023.
Related: Bitcoin distribution ‘danger zone’ over, analysts say
This article does not contain investment advice or recommendations. Every investment and trading move involves risk, and readers should conduct their own research when making a decision.

Responses