Price analysis 2/7: BTC, ETH, BNB, SOL, XRP, ADA, AVAX, DOGE, DOT, LINK
Bitcoin’s price-bound price action could reach a breaking point if the sharp drop in U.S. regional bank stocks intensifies. How might altcoins react?

Bitcoin (BTC) has not displayed any fireworks since the launch of spot Bitcoin exchange-traded funds (ETFs), but that has not stopped investors from piling into select ETFs. According to senior Bloomberg ETF analyst Eric Balchunas, BlackRock’s iShares Bitcoin Trust ETF has catapulted into the top 5 ETFs in year-to-date flows.
The launch of the spot Bitcoin ETFs has resulted in investors shifting from gold to Bitcoin, according to ARK Invest CEO Cathie Woods. While speaking in a YouTube chat with chief futurist Brett Winton, Woods said that Bitcoin is likely to behave as a “risk off asset” during the next banking crisis.

The more than 60% fall in New York Community Bancorp (NYCB) stock since Jan. 30 brings back memories of the banking crisis seen a year ago. The fall is of particular interest to the crypto community because NYCB had acquired the failed crypto-focused Signature Bank in 2023.
Could the developing banking crisis boost Bitcoin’s price in the near term? Will the altcoins follow? Let’s analyze the charts of the top 10 cryptocurrencies to find out.
Bitcoin price analysis
Bitcoin has been trading inside a tight range for the past few days, indicating a tough tussle between the bulls and the bears.

The bulls hold a slight edge as the price has been trading above the 20-day exponential moving average ($42,577) for several days. Buyers will have to overcome the obstacle at $44,700 to build positive momentum. The BTC/USDT pair may soar to the psychological resistance at $50,000.
Contrary to this assumption, if the price turns down and breaks below the 20-day EMA, it will indicate an advantage to the bears. The pair may then slump to $40,000 and eventually to $37,980. This level is likely to see solid buying by the bulls.
Ether price analysis
Ether (ETH) surged above the moving averages on Feb. 6, indicating that the bulls are trying to seize control.

The price has reached the stiff overhead resistance of $2,400. The bears will try to defend this level with all their might because if they fail in their endeavor, the ETH/USDT pair could jump to $2,600 and later to $2,717.
Conversely, if the price turns down sharply and breaks below the uptrend line, it will indicate that the bears are fiercely defending the $2,400 level. The pair may swing inside the $2,100 to $2,400 range for a few more days.
BNB price analysis
The bulls have managed to ward off the onslaught from the bears and kept BNB (BNB) above the 50-day SMA ($303) in the past few days.

The flattish 20-day EMA ($303) and the RSI near the midpoint do not give a clear advantage either to the bulls or the bears. If buyers kick the price above the downtrend line, the BNB/USDT pair could rise to $320 and subsequently to $338.
On the other hand, if the price turns lower and breaks below $296, it will indicate advantage to the bears. The pair could then descend to the vital support at $288. If this level cracks, the pair will complete a bearish descending triangle pattern. The next support on the downside is at $260.
Solana price analysis
The bulls are finding it difficult to start a rebound off the 20-day EMA ($96) in Solana (SOL), indicating a lack of demand at higher levels.

The immediate support is at $93. If this level gives way, the SOL/USDT pair risks a fall to the strong support at $80. If the price turns up sharply from $80, the pair may reach the 20-day EMA. A break above this resistance suggests that the pair may consolidate between $107 and $80 for a while.
The bulls will have to push and retain the price above $107 to get back in the driver’s seat. The pair could then rally to the overhead resistance at $126.
XRP price analysis
The bulls are trying to hold XRP (XRP) above the $0.50 support, but the weak bounce suggests that the bears have maintained their pressure.

The XRP/USDT pair is likely to sink below $0.50, which could start the next leg of the down move to the solid support at $0.46. This level has held on two previous occasions; hence, the bulls will again try to arrest the fall at this support.
Buyers will have to push and maintain the price above the 20-day EMA to indicate that the bears may be losing their grip. The pair could then attempt a rally to the downtrend line, which remains the key level to watch out for. A break above the downtrend line could suggest the start of a rally to $0.67.
Cardano price analysis
The failure of the bulls to push Cardano (ADA) above the 20-day EMA ($0.50) in the past few days increased the selling pressure on Feb. 7.

The ADA/USDT pair could slide to the strong support at $0.46, where buyers are likely to step in. If the price bounces off $0.46 but returns from the 20-day EMA, it will indicate that the sentiment remains negative and traders are selling on rallies. That will enhance the prospects of a drop to the channel’s support line.
On the contrary, if the price turns up from $0.46 and breaks above the 20-day EMA, it will indicate that the bulls are attempting a comeback. The pair may then surge to the downtrend line.
Avalanche price analysis
Avalanche (AVAX) tried to start a relief rally from the 20-day EMA ($34.49) on Feb. 5, but the long wick on the candlestick shows that the bears are selling at higher levels.

The bears will try to gain the upper hand in the near term by pulling the price below the $32 support. If they manage to do that, the AVAX/USDT pair could descend to the support line of the descending channel.
Instead, if the price turns up and breaks above the downtrend line, it will indicate that the bulls are back in command. The pair could rally to $44 and after that to the critical resistance at $50.
Related: Regulated OTC desks could spur crypto adoption
Dogecoin price analysis
Dogecoin (DOGE) remains stuck between the uptrend line of the symmetrical triangle and the 20-day EMA ($0.08).

The downsloping 20-day EMA and the RSI in the negative territory give a slight edge to the bears. If the price plunges below the uptrend line, the DOGE/USDT pair could decline to $0.07. This level is likely to attract buyers, but if the bulls fail to push the price back into the triangle, the likelihood of a drop to $0.06 increases.
Alternatively, if buyers drive the price above the 20-day EMA, the pair could attempt a rally to the downtrend line. The bulls will have to clear this hurdle to signal the start of an up move to the $0.10 to $0.11 resistance zone.
Polkadot price analysis
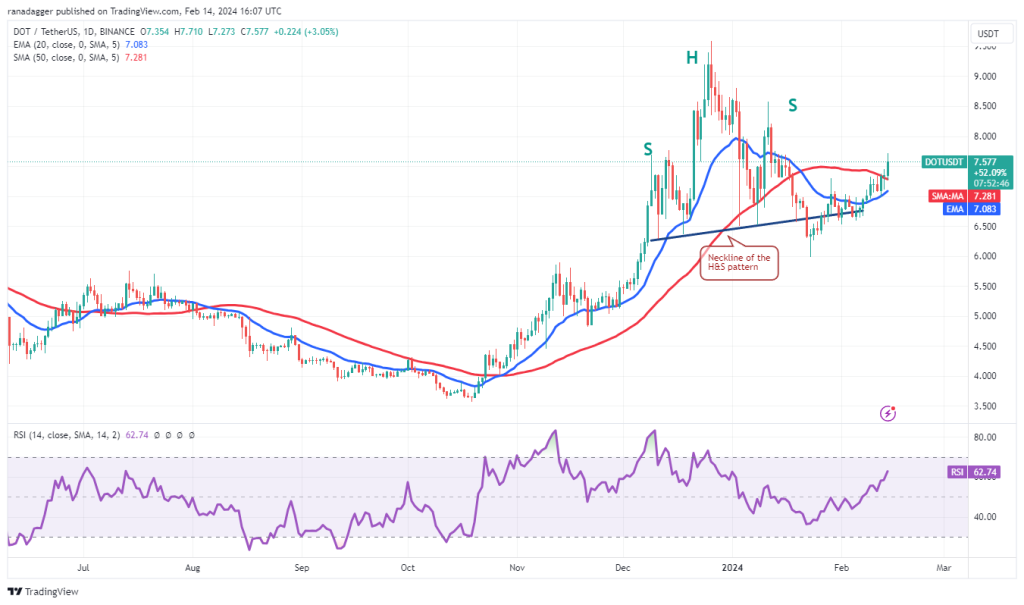
The bulls have repeatedly failed to push and maintain Polkadot (DOT) above the 20-day EMA ($6.86) in the past few days, indicating that the bears are defending the level aggressively.

The bears will try to strengthen their position further by pulling the price below the nearby support at $6.50. If they manage to do that, the DOT/USDT pair could start a downward move to $6 and thereafter to $5.40.
Any recovery attempt is likely to face selling at the 20-day EMA. If bulls overcome this barrier, the pair may climb to the 50-day SMA ($7.42). A break and close above this level will signal a potential trend change in the near term.
Chainlink price analysis
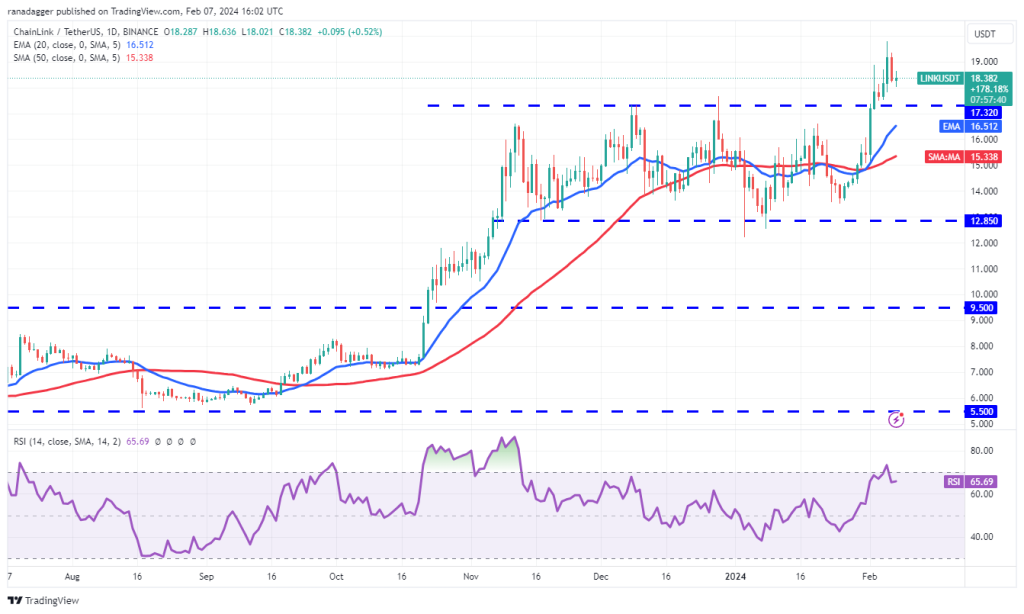
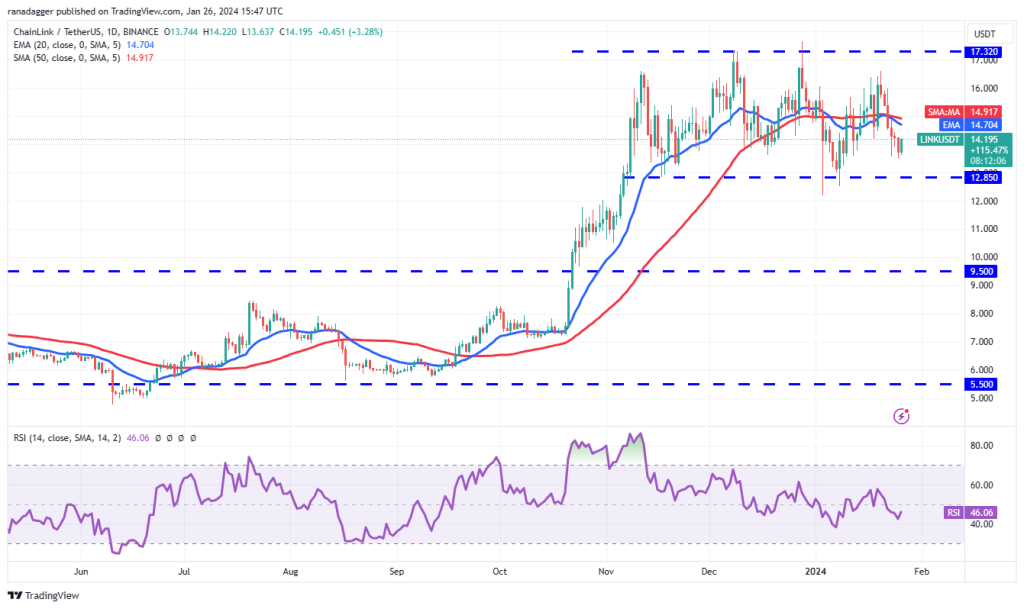
Chainlink (LINK) is in an uptrend, but the price turned down from $19.79 on Feb. 5, indicating that the bears are vigorously defending the $20 level.

After the breakout from a range, the price usually turns down and retests the breakout level. The LINK/USDT pair could drop to $17.32, which is an important level to keep an eye on.
If the price bounces off $17.32, it will indicate that the bulls have flipped the level into support. That will increase the likelihood of the continuation of the uptrend. The pair may then attempt a rally to $21.79.
This positive view will be invalidated in the near term if the price turns down and plummets below the 20-day EMA ($16.51).

… [Trackback]
[…] Find More on on that Topic: x.superex.com/academys/markets/4218/ […]
… [Trackback]
[…] Read More on to that Topic: x.superex.com/academys/markets/4218/ […]
… [Trackback]
[…] There you will find 10174 additional Info to that Topic: x.superex.com/academys/markets/4218/ […]
… [Trackback]
[…] Information on that Topic: x.superex.com/academys/markets/4218/ […]
… [Trackback]
[…] Read More on that Topic: x.superex.com/academys/markets/4218/ […]
… [Trackback]
[…] There you can find 48728 additional Information to that Topic: x.superex.com/academys/markets/4218/ […]
… [Trackback]
[…] Read More to that Topic: x.superex.com/academys/markets/4218/ […]
… [Trackback]
[…] Find More Information here on that Topic: x.superex.com/academys/markets/4218/ […]
… [Trackback]
[…] There you will find 19491 more Information on that Topic: x.superex.com/academys/markets/4218/ […]
… [Trackback]
[…] Read More on that Topic: x.superex.com/academys/markets/4218/ […]
… [Trackback]
[…] Here you will find 11807 additional Information to that Topic: x.superex.com/academys/markets/4218/ […]
… [Trackback]
[…] Find More Info here on that Topic: x.superex.com/academys/markets/4218/ […]
… [Trackback]
[…] Info on that Topic: x.superex.com/academys/markets/4218/ […]
… [Trackback]
[…] Find More Information here to that Topic: x.superex.com/academys/markets/4218/ […]
… [Trackback]
[…] Information to that Topic: x.superex.com/academys/markets/4218/ […]
… [Trackback]
[…] Find More to that Topic: x.superex.com/academys/markets/4218/ […]
… [Trackback]
[…] Information to that Topic: x.superex.com/academys/markets/4218/ […]
… [Trackback]
[…] There you can find 41868 more Info to that Topic: x.superex.com/academys/markets/4218/ […]