A beginner’s guide to the Bitcoin stock-to-flow model


Bitcoin stock to flow
Starting to invest in cryptocurrencies can be a daunting task, as digital currencies are notoriously volatile, making it difficult for new investors to make informed investing decisions. Given these difficulties, one might find it helpful to use the “stock-to-flow” (SF or S2F) model to make a more structured decision.
Crypto investments, like traditional stock market investments, rely on anticipating where the value of various assets will go. The stock-to-flow ratio is one such model that can assist in this effort. It is a number that indicates the number of years it will take to attain the current stock (supply) at the current production rate. The higher the number, the more expensive it generally is!
The SF ratio has historically correlated with Bitcoin’s (BTC) price, making it a popular methodology for forecasting future BTC price valuations. Bitcoin is the world’s first, and its most known, scarce digital object. Just like silver and gold, its supply is limited — only 21 million coins will ever be in circulation.
The stock-to-flow concept takes advantage of the fact that Bitcoin’s scarcity increases its value. By assessing Bitcoin’s digital scarcity, the stock-to-flow ratio forecasts its value.
Is Bitcoin stock-to-flow accurate for price predictions? Here’s a closer look at the stock-to-flow concept and how it works, as well as how to invest in crypto using the stock-to-flow model.
Bitcoin’s scarcity and stock-to-flow ratio
Scarcity creates “unforgeable costliness” and assigns intrinsic value to an asset, according to Nick Szabo, an American cryptographer and computer scientist.
The underlying technology that underpins Bitcoin assures that the quantity of new coins decreases over time, increasing scarcity. A “block reward” is given to the miner that calculates the hash required to validate a block of transactions, producing a proof-of-work.
Every 210,000 blocks, the block reward is halved — a phenomenon called the “Bitcoin halving.” From 50 BTC in 2009 to 25 BTC in 2012, 12.5 BTC in 2016 and 6.25 BTC in 2020, the block reward continues to decrease. The next halving will take place in the spring of 2024.
The Bitcoin halving has historically caused the price of BTC to skyrocket. Given that the price of Bitcoin rises as the supply of the cryptocurrency tightens, investors can use scarcity measures to determine the best time to invest in BTC.
The stock-to-flow model predicts value changes in a more straightforward manner. It compares an asset’s current stock to the rate of new production, or how much is produced in a year. A higher ratio suggests greater scarcity, which generally leads to a higher price. A pseudonymous Dutch former institutional investor known as “PlanB” popularized the Bitcoin stock-to-flow ratio.
Stock-to-flow was originally applied to gold and silver, but it has subsequently been adopted by the cryptocurrency community, primarily in regard to BTC. Bitcoin, like these other commodities, is rare and expensive to generate; therefore, supply and flow are likely the most critical elements in determining its value.
Technological advancements in the precious-metal mining industry result in faster gold production, whereas Bitcoin production is more evenly distributed due to halving events.
Furthermore, cryptocurrency — unlike gold and silver — cannot be converted into items or components. As a result, every crypto token represents a potential supply because investors can sell all their tokens at any time. Hence, a high stock-to-flow ratio in crypto represents relative, not absolute, value.
This relative regular inflow makes Bitcoin’s stock-to-flow ratio considerably easier to anticipate, albeit it isn’t always ideal — as Bitcoin matures as an asset, macro factors will increasingly influence its price.
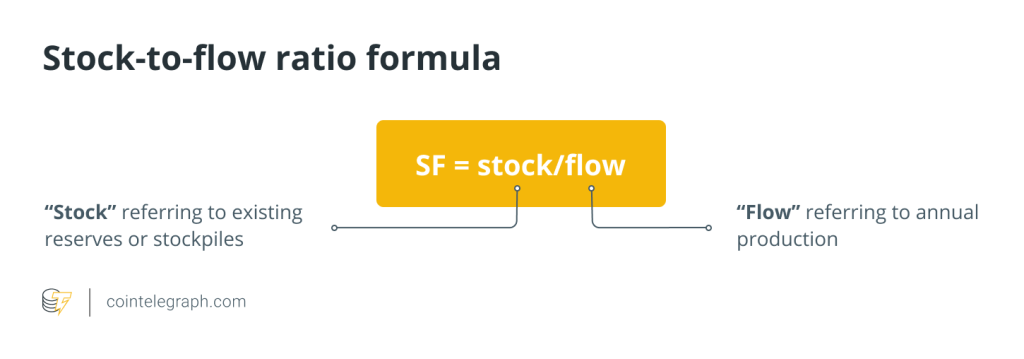
The stock-to-flow ratio compares the existing stock (total amount available) of a commodity to the flow of new production (amount mined during a specific year).

Let’s understand how Bitcoin stock-to-flow works as a formula. At the time of writing, Bitcoin has a stock of 18,847,331 BTC, which is 89.74% of the total supply, with an annual flow of 328,500 BTC. The number representing the stock changes every 10 minutes or so as additional blocks are mined.
Inputting these values into the stock/flow formula gives an SF ratio of 57.374 (18,847,331/328,500). Consequently, mining the current total BTC supply would take roughly 57 years (without taking the maximum supply and halvings into account).
Furthermore, Bitcoin halving occurrences increase the S2F ratio by increasing scarcity, causing the price of Bitcoin to climb. It is the most important metric for investors to understand why Bitcoin is classified as a currency rather than a commodity.
Is Bitcoin stock-to-flow accurate for price predictions?
While the Bitcoin stock-to-flow ratio has shown some historical association with BTC price, the methodology has significant limitations when it comes to forecasting the future value fluctuations of digital assets.
For example, the model solely considers Bitcoin’s supply but ignores the cryptocurrency’s demand. The two most fundamental factors in determining the price of an asset are supply and demand. As a result, even though BTC’s SF ratio increases every four years during halving events, its price will fall dramatically if demand falls significantly.
Furthermore, the Bitcoin stock-to-flow model does not account for the following factors that could affect the asset’s price:
-
Volatility: Despite the fact that Bitcoin’s volatility has dropped dramatically over the years, it is still vulnerable to large price swings. Investors may panic sell their holdings after a substantial value loss during a highly volatile period, liquidating traders’ long positions and resulting in a significant decline in BTC price.
-
Black swan events: In economics, black swan events are unforeseeable occurrences that have significant consequences, particularly for the price of an asset. A black swan event for Bitcoin could be a major regulatory crackdown that effectively prohibits anyone from buying and trading the cryptocurrency. The price of BTC could plummet as a result of such a hypothetical situation.
Other crypto forecasting models
Market investors’ psychology, often known as “collective psychology” or “crowd psychology,” is used to evaluate financial market cycles using the Elliott Wave Theory. In the 1930s, American accountant Ralph Nelson Elliott proposed the Elliott Wave Theory.
The wave patterns, according to the Elliott Wave Theory, grow in either straight lines or with ups and downs. Across all financial markets, including cryptocurrency trading, the price varies between impulsive and alternative stages, repeating the same cycles. The waves seen are identical, recurrent and separated into five wave sets that alternate between motive and corrective waves.
Another prediction model known as the Bitcoin Rainbow Chart is a color-banded logarithmic chart of Bitcoin’s price evolution. The colored bars were developed by Über Holger, CEO of Holger, using a logarithmic regression provided by Bitcointalk member “Trolololo” in 2014. These bands, Holger has acknowledged, are utterly arbitrary and have no scientific basis; thus, they are only correct until some future date, though there are no timescales specified in the hypothesis.
The chart allows users to track price changes over time, ignoring the inevitable fluctuations caused by daily volatility, and gain a sense of when the best periods to buy or sell BTC were in the past.
The Rainbow Chart, according to Holger, does not provide investment advice because past performance is not indicative of future results. However, it does divide the price of Bitcoin into eight bands of arbitrary color: definite bubble, FOMO (fear of missing out), sell, bubble formation, still cheap, HODL, buy, accumulate and deeply discounted.
How to invest in cryptocurrencies using the stock-to-flow model
Despite these flaws, understanding how to employ the stock-to-flow model in crypto trades might be beneficial. In theory, when a cryptocurrency’s stock-to-flow ratio rises, so too will its value, according to the model’s history. This relationship can help one make investment decisions.
A high stock-to-flow ratio, such as 50 or greater, suggests intense relative scarcity, implying that values will also increase. An investor might see that ratio and opt to sell some of their cryptocurrency to profit from its current high price. Alternatively, when the ratio is low but expected to rise in the future, they may buy more.
Despite its limits, understanding how to use the stock-to-flow ratio in crypto can be a valuable financial strategy. When exploring investing in cryptocurrencies, this model should be added to one’s list of forecasting tools.


… [Trackback]
[…] Find More Info here on that Topic: x.superex.com/academys/beginner/3128/ […]
… [Trackback]
[…] Read More Information here to that Topic: x.superex.com/academys/beginner/3128/ […]
… [Trackback]
[…] Info to that Topic: x.superex.com/academys/beginner/3128/ […]
… [Trackback]
[…] Read More Information here on that Topic: x.superex.com/academys/beginner/3128/ […]
… [Trackback]
[…] Find More here on that Topic: x.superex.com/academys/beginner/3128/ […]
… [Trackback]
[…] Here you will find 86864 additional Information to that Topic: x.superex.com/academys/beginner/3128/ […]
… [Trackback]
[…] There you can find 69749 more Info on that Topic: x.superex.com/academys/beginner/3128/ […]
… [Trackback]
[…] Find More on that Topic: x.superex.com/academys/beginner/3128/ […]
… [Trackback]
[…] Read More on to that Topic: x.superex.com/academys/beginner/3128/ […]
… [Trackback]
[…] Read More on that Topic: x.superex.com/academys/beginner/3128/ […]
… [Trackback]
[…] Find More Info here on that Topic: x.superex.com/academys/beginner/3128/ […]
… [Trackback]
[…] Find More on that Topic: x.superex.com/academys/beginner/3128/ […]
… [Trackback]
[…] Find More Info here on that Topic: x.superex.com/academys/beginner/3128/ […]
… [Trackback]
[…] Info on that Topic: x.superex.com/academys/beginner/3128/ […]
… [Trackback]
[…] Find More here on that Topic: x.superex.com/academys/beginner/3128/ […]
… [Trackback]
[…] Information on that Topic: x.superex.com/academys/beginner/3128/ […]
… [Trackback]
[…] Read More to that Topic: x.superex.com/academys/beginner/3128/ […]
… [Trackback]
[…] Read More on that Topic: x.superex.com/academys/beginner/3128/ […]
… [Trackback]
[…] Read More on that Topic: x.superex.com/academys/beginner/3128/ […]
… [Trackback]
[…] Read More here on that Topic: x.superex.com/academys/beginner/3128/ […]
… [Trackback]
[…] Information on that Topic: x.superex.com/academys/beginner/3128/ […]
… [Trackback]
[…] Read More Info here to that Topic: x.superex.com/academys/beginner/3128/ […]
… [Trackback]
[…] Read More on that Topic: x.superex.com/academys/beginner/3128/ […]
… [Trackback]
[…] Find More on that Topic: x.superex.com/academys/beginner/3128/ […]
… [Trackback]
[…] Find More here on that Topic: x.superex.com/academys/beginner/3128/ […]