
LEARN DEMAND INDEX IN 3 MINUTES

SuperEx Academy is the world’s first online academy to offer comprehensive education on cryptonative indicators. It features one of the most extensive collections of technical indicator tutorials and provides detailed, beginnerfriendly learning resources for market technical analysis. Here, users can explore hundreds of commonly used indicators, as well as a wide range of cryptonative indicator tutorials designed for the evolving digital asset market.
Opening: Is The Move Real?
The market loves drama. One candle pumps, the chat gets loud, someone says the cycle is back, and three minutes later price returns to where it started. Demand Index, often abbreviated as DI, is built for exactly this kind of situation. It asks a practical question: is the price move supported by real buying or selling pressure, or is it just a noisy candle pretending to be important?
Unlike a simple momentum indicator, Demand Index does not only look at price direction. It combines price movement with volume, trying to measure whether demand is stronger than supply. In crypto, where fake breakouts and thin-liquidity moves are common, that extra volume context can be extremely useful.
History: James Sibbet And The Search For Real Pressure
The Demand Index was developed by James Sibbet. It became known as a volume-based indicator designed to compare buying pressure with selling pressure. Classic technical analysis references often describe it as a potentially leading indicator because it can turn before price does.
Sibbet’s original calculation is relatively complex. Some references mention that the full calculation uses many intermediate steps, so different charting platforms may implement slightly different versions. This is important: do not obsess over whether one platform’s DI value is exactly the same as another platform’s value. Focus on direction, zero-line behavior, divergence, and confirmation.
Core Concept: Demand Versus Supply
Demand Index tries to estimate whether buying pressure is stronger than selling pressure. The general idea can be written like this:
Demand Index = Smoothed relationship between Buying Pressure and Selling Pressure
Buying pressure and selling pressure are usually derived from price change, trading volume, and sometimes the high-low range of the candle. If price rises with meaningful volume, demand is considered stronger. If price falls with meaningful volume, supply is considered stronger.
A simplified way to understand it is:
- Positive DI = buying pressure dominates
- Negative DI = selling pressure dominates
- DI near zero = no clear side has control
This is why DI is useful. Price alone tells you what happened. Demand Index tries to tell you whether the move had participation behind it.
How To Read It
The zero line is the first thing to watch. When DI moves above zero, buying pressure is stronger than selling pressure. When DI moves below zero, selling pressure is stronger than buying pressure. A clean zero-line cross can suggest a shift in trend pressure.
But not every zero-line cross is useful. If DI keeps chopping around zero, the market is probably weak, directionless, or stuck in a noisy range. This is not the moment to overreact. It is the chart version of someone typing a long message and then deleting it.
The second major signal is divergence. If price makes a higher high, but DI makes a lower high, the rally may be losing real demand. This is bearish divergence. It does not mean price must crash immediately, but it says the move is becoming less healthy.
If price makes a lower low, but DI makes a higher low, selling pressure may be weakening. This is bullish divergence. In crypto, this often appears after panic selling, liquidation cascades, or a long downtrend where sellers are getting tired.
The third signal is trendline behavior on DI itself. You can draw trendlines on the indicator. If price has not yet broken resistance but DI has already broken its own downtrend line, demand may be improving early. If price is still strong but DI breaks its support line, buying pressure may be slipping.
Practical Long Setup
A practical long setup does not rely on DI alone. Look for several conditions working together:
1. Price is above a key moving average.
2. DI crosses above zero or breaks its own downtrend line.
3. Volume expands on green candles.
4. Price breaks resistance or retests support successfully.
5. Stop-loss can be placed below the breakout level or recent swing low.
For example, if ETH breaks a resistance level while DI moves strongly above zero, the breakout has better quality. If ETH breaks resistance but DI stays near zero, the breakout may lack participation. That does not mean it must fail, but it deserves smaller position size or stricter confirmation.
Practical Short Setup
A practical short setup looks for supply pressure taking control:
1. Price is below a falling moving average.
2. DI crosses below zero.
3. Price fails near resistance.
4. Red candles show stronger volume than rebound candles.
5. Risk is defined above resistance or the recent swing high.
If price is falling and DI remains negative, sellers still control the move. If price bounces but DI cannot return above zero, that bounce may be only a weak reaction. In plain language, the rebound has posture, but no real fuel.
Parameters And Platform Differences
Demand Index parameters depend on the platform. Some versions use a period for smoothing. Some versions also use threshold constants or separate moving average settings for buy and sell pressure. Common short settings are more responsive, while longer settings are smoother.
For crypto traders, a practical starting point is to test DI on the same timeframe you actually trade. If you trade 15-minute charts, do not optimize the indicator only on daily charts. If you trade daily swings, do not judge it by one-minute noise.
A useful rule: short smoothing helps entries, longer smoothing helps market regime judgment. For example, use daily DI to judge whether demand is broadly improving, then use a lower timeframe to time the entry.
Crypto Trading Example
Imagine SOL has been moving sideways between 145 and 155. Price tests 155 three times. On the first test, DI rises strongly. On the second test, DI rises less. On the third test, price slightly breaks 155, but DI is much weaker than before.
This is not a clean breakout. It is a warning that price is making progress, but demand is not. A trader could wait for confirmation instead of chasing. Confirmation might be a strong close above 155 with DI rising again, or a failed breakout followed by a short setup.
Now imagine BTC falls below support, but DI does not make a new low and begins to climb. This may indicate seller exhaustion. A trader still should not blindly catch the bottom, but it can be a reason to watch for reclaim setups, bullish engulfing candles, or a break above a short-term descending trendline.
Best Combinations
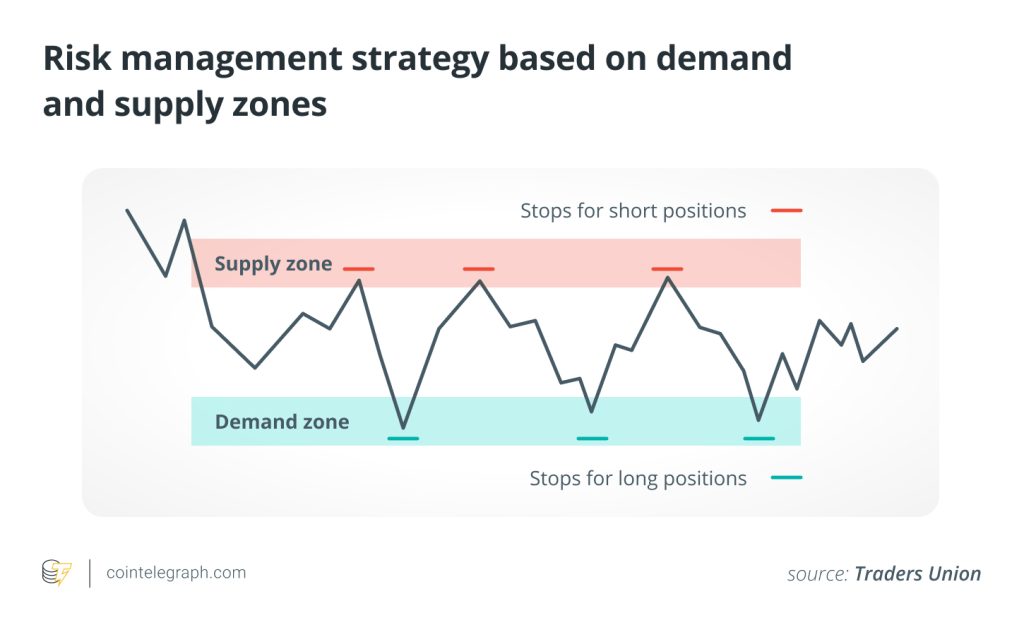
Demand Index works especially well with support and resistance. A DI bullish divergence near support is more meaningful than a random bullish divergence in the middle of a range. Location matters.
It also pairs well with moving averages. Use EMA 50 or EMA 200 to define the larger trend. In an uptrend, bullish DI signals are usually higher quality than bearish DI signals. In a downtrend, bearish DI signals usually deserve more respect.
Volume tools can help too. OBV, Money Flow Index, or Volume Profile can confirm whether DI is telling the same story. If multiple volume-based tools agree, the signal has more weight. If they conflict, reduce confidence.
Common Mistakes
The first mistake is treating DI as a magic leading indicator. It can lead price, but it does not predict the future with certainty. It measures pressure. Pressure can build for a while before price reacts, and sometimes the market simply ignores it.
The second mistake is comparing DI values across platforms too strictly. Because implementations can differ, one platform may show a slightly different reading from another. Focus on pattern, trend, divergence, and zero-line behavior.
The third mistake is buying every positive DI reading. Positive demand in a downtrend may only produce a bounce. Negative supply in an uptrend may only produce a pullback. Always ask: is this signal aligned with the bigger market structure?
Key Takeaways
Demand Index is a price-and-volume indicator developed by James Sibbet to compare buying pressure with selling pressure. It is mainly used to identify demand strength, supply strength, zero-line trend shifts, and divergences.
Use DI as a confirmation and early-warning tool. The best signals usually appear when DI agrees with price structure, volume behavior, and the larger trend. Used alone, it can be noisy. Used with context, it can help traders avoid chasing weak moves and notice pressure changes earlier.




Responses