
LEARN COPPOCK CURVE INDEX IN 3 MINUTES


SuperEx Academy is the world’s first online academy to offer comprehensive education on cryptonative indicators. It features one of the most extensive collections of technical indicator tutorials and provides detailed, beginnerfriendly learning resources for market technical analysis. Here, users can explore hundreds of commonly used indicators, as well as a wide range of cryptonative indicator tutorials designed for the evolving digital asset market.
Opening: This Indicator Is Slow, On Purpose
Some indicators are built for traders who refresh the chart every ten seconds. Coppock Curve is not one of them. It is more like the calm person in the room who waits until everyone finishes panicking before saying, “Now we can talk.”
Coppock Curve is a long-term momentum indicator. It was designed to identify major buying opportunities after deep market declines, not to catch every small swing.
In simple terms: it is not asking, “Should I scalp this candle?” It is asking, “Has the market recovered enough to start a new major trend?”

History
The Coppock Curve was developed by Edwin Sedgwick Coppock, often known as “Sedge” Coppock. He was an economist and market technician.
The indicator was introduced in Barron’s in the early 1960s. Some references cite 1962, while some charting sources cite 1965. The key point is that it was created for long-term stock-market analysis, especially major indexes.
A famous story behind the indicator is that Coppock considered the emotional recovery period after a major loss. The default 11-month and 14-month rate-of-change periods were connected to the idea that investors, like people, need time to recover after painful losses.
This is why Coppock Curve is slow. It was built to detect major recovery, not every short-term bounce.
How It Works
Coppock Curve combines two Rate of Change values and then smooths them with a Weighted Moving Average.
The standard formula is: Coppock Curve = 10-period WMA of [14-period ROC + 11-period ROC]
ROC means Rate of Change.
A common ROC formula is: ROC = [(Current Close – Close N Periods Ago) / Close N Periods Ago] × 100
- The 14-period ROC measures longer momentum.
- The 11-period ROC measures slightly shorter momentum.
- The 10-period WMA smooths the combined momentum reading.
Because WMA gives more weight to recent data, Coppock Curve reacts faster than a simple average, but it is still much slower than short-term oscillators.
How To Read It
The zero line is the main reference point.
- When Coppock Curve is below zero, long-term momentum is still negative.
- When Coppock Curve is above zero, long-term momentum is generally positive.
The classic signal is an upturn from below zero.
This does not mean the exact bottom has been found. In fact, Coppock Curve usually signals after the bottom, because it wants evidence that recovery has already started.
Some traders wait for the curve to cross above zero for stronger confirmation.
That signal is later, but cleaner.
- A curve that is rising below zero often means bearish pressure is fading.
- A curve that is rising above zero often means bullish momentum is already established.
- A curve that turns downward above zero can warn that momentum is cooling.
- A curve that falls below zero can show that long-term momentum has weakened.
Important: Coppock Curve was originally designed mainly for buy signals. Sell signals were not its original purpose.
Modern traders may use a cross below zero as a risk warning, but exits should still be managed with other tools.
Practical Trading Use
The first use is identifying major recovery zones.
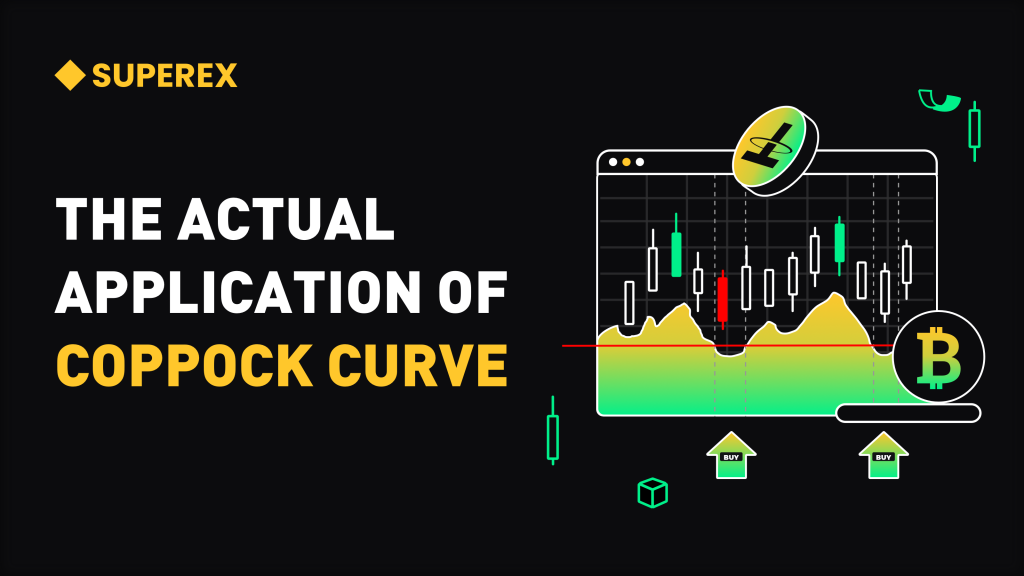
If BTC has gone through a long bear market and Coppock Curve turns upward from below zero on a weekly or monthly chart, it may suggest that long-term selling pressure is fading.
The second use is confirming macro trend improvement.
If Coppock Curve rises above zero while price breaks a long-term resistance level, the bullish signal becomes more meaningful.
The third use is avoiding premature bottom fishing.
A token can look cheap for months and still keep falling. Coppock Curve helps traders wait until momentum actually starts improving.
The fourth use is filtering portfolio entries.
Long-term investors can use Coppock Curve to decide when market conditions are improving enough to gradually build positions.
This is especially useful for crypto investors who do not want to trade every small move but still want a structured timing tool.
Timeframe And Settings
The classic setting is 14, 11, and 10 on monthly data.
That means:
- 14-month ROC
- 11-month ROC
- 10-month WMA
For crypto, many traders test it on weekly charts because crypto cycles move faster than traditional equity cycles.
Daily charts can be used, but they are much noisier.
If you use Coppock Curve on low timeframes, do not expect it to behave like the original long-term indicator.
A practical rule:
- Monthly Coppock Curve is for macro investors.
- Weekly Coppock Curve is for cycle traders.
- Daily Coppock Curve is for active traders, but signals need more filtering.
Crypto Example
Suppose BTC has fallen for several months, and Coppock Curve is deeply below zero.At this stage, the market may look cheap, but the indicator is still saying long-term momentum is weak.
Then BTC stops making new lows, volume improves, and Coppock Curve begins turning upward from below zero.This does not guarantee a bull market, but it suggests that the selling phase may be losing strength.
If BTC later breaks a major resistance level and Coppock Curve crosses above zero, the long-term bullish case becomes stronger.For ETH or large-cap altcoins, the same logic applies. The indicator works best when you are looking for broad cycle recovery, not five-minute chart excitement.
Best Combinations
Coppock Curve works well with long-term moving averages.
For example, if price moves above the 200-day moving average while Coppock Curve turns upward, the recovery signal has stronger context.
It also works well with support and resistance.
A Coppock upturn after price holds a major support zone is more meaningful than an isolated indicator turn.
Volume is important too.
A long-term momentum recovery with rising volume is more credible than a recovery with weak participation.
Market breadth can also help.
If BTC improves, ETH improves, and many major tokens also begin recovering, the Coppock signal is more convincing.
Common Mistakes
The first mistake is using Coppock Curve for short-term scalping.
It was not built for that. On very short timeframes, it can become slow, late, and noisy.
The second mistake is expecting it to catch the exact bottom.
Coppock Curve is confirmation-based. It usually signals after recovery has started.
The third mistake is using it as a sell signal without context.
The original design focused on buy signals. Modern sell usage needs extra confirmation.
The fourth mistake is ignoring asset quality.
A Coppock upturn on BTC or ETH is different from a Coppock upturn on a low-liquidity token.
The fifth mistake is ignoring risk management.
A long-term buy signal still needs position sizing, invalidation levels, and exit rules.
Key Takeaways
Coppock Curve is a long-term momentum indicator.It was developed by Edwin Sedgwick Coppock.The classic formula is a 10-period WMA of 14-period ROC plus 11-period ROC.
It was originally designed to identify long-term buying opportunities.
- An upturn from below zero is the classic bullish signal.
- A cross above zero gives stronger but later confirmation.
For crypto traders, Coppock Curve is useful because it helps separate real cycle recovery from random relief rallies.





Responses