LEARN FRACTAL INDICATOR INDEX IN 3 MINUTES ——BLOCKCHAIN 101
SuperEx Academy is the world’s first online academy to offer comprehensive education on crypto-native indicators. It features the most extensive technical indicator tutorials and is the most detailed online learning platform for market technical analysis. Here, you’ll find hundreds of courses on commonly used indicators, along with nearly every known crypto-native indicator tutorial.
Today’s lesson focuses on the Fractal Indicator, a technical indicator proposed by Bill Williams. Its core idea is:
Market prices do not move linearly—they are full of repeating patterns, much like fractal structures in nature.
In simple terms:
-
A fractal is a pattern composed of five candlesticks, with the middle one being the key point.
-
It is used to identify local highs or lows in price and helps us judge potential reversal areas.
- Click to register SuperEx
- Click to download the SuperEx APP
- Click to enter SuperEx CMC
- Click to enter SuperEx DAO Academy — Space
Historical Background of the Fractal Indicator
-
Theoretical origin: Chaos theory and fractal geometry
The concept of fractals was first proposed by French mathematician Benoit Mandelbrot in 1975 to describe complex structures in nature that are self-similar and repetitive (such as snowflakes, coastlines, and tree branches). His book The Fractal Geometry of Nature (1982) is a foundational work that influenced finance, physics, computing, and more.
Financial market price action often exhibits “order within disorder,” i.e., similar patterns recur across different timeframes. This is the inspiration behind applying fractal theory to markets.
-
Application to financial markets
In the 1980s–1990s, many researchers attempted to apply fractal geometry to financial markets to explain the chaotic characteristics of prices. They found that markets are not entirely random but show self-similarity—for example, shapes on a 1-minute chart can also be seen on daily or weekly charts. This idea propelled the creation of the fractal indicator. -
Bill Williams’ contribution
Bill M. Williams, a renowned trading psychologist and technical analyst, published Trading Chaos in 1995. He introduced the Fractal Indicator and, together with the Alligator and Awesome Oscillator, formed his “chaos trading system.”
His views:
-
Markets are not fully predictable, but there are rules within chaos; traders can use fractals to discover potential turning points.
-
As a result, the fractal indicator was gradually included in mainstream platforms such as MetaTrader (MT4/MT5) and became a standard tool.
Identification Logic of the Fractal Indicator
A standard fractal pattern consists of five consecutive candlesticks:
-
Bullish Fractal
The high of the middle candlestick is higher than the highs of the two candlesticks on both the left and right. This indicates a possible local top, suggesting price may fall or consolidate. -
Bearish Fractal
The low of the middle candlestick is lower than the lows of the two candlesticks on both the left and right. This indicates a possible local bottom, suggesting price may rise.
It’s like placing a small arrow on the chart to remind you: “A change may be coming here.”
-
Formulas and calculation
A fractal is not based on a complex formula; it is essentially a pattern definition:
1)Up fractal conditions:
High[i] > High[i-1], High[i] > High[i-2],
High[i] > High[i+1], High[i] > High[i+2]
2)Down fractal conditions:
Low[i] < Low[i-1], Low[i] < Low[i-2],
Low[i] < Low[i+1], Low[i] < Low[i+2]
Here, i is the center candlestick of the fractal.
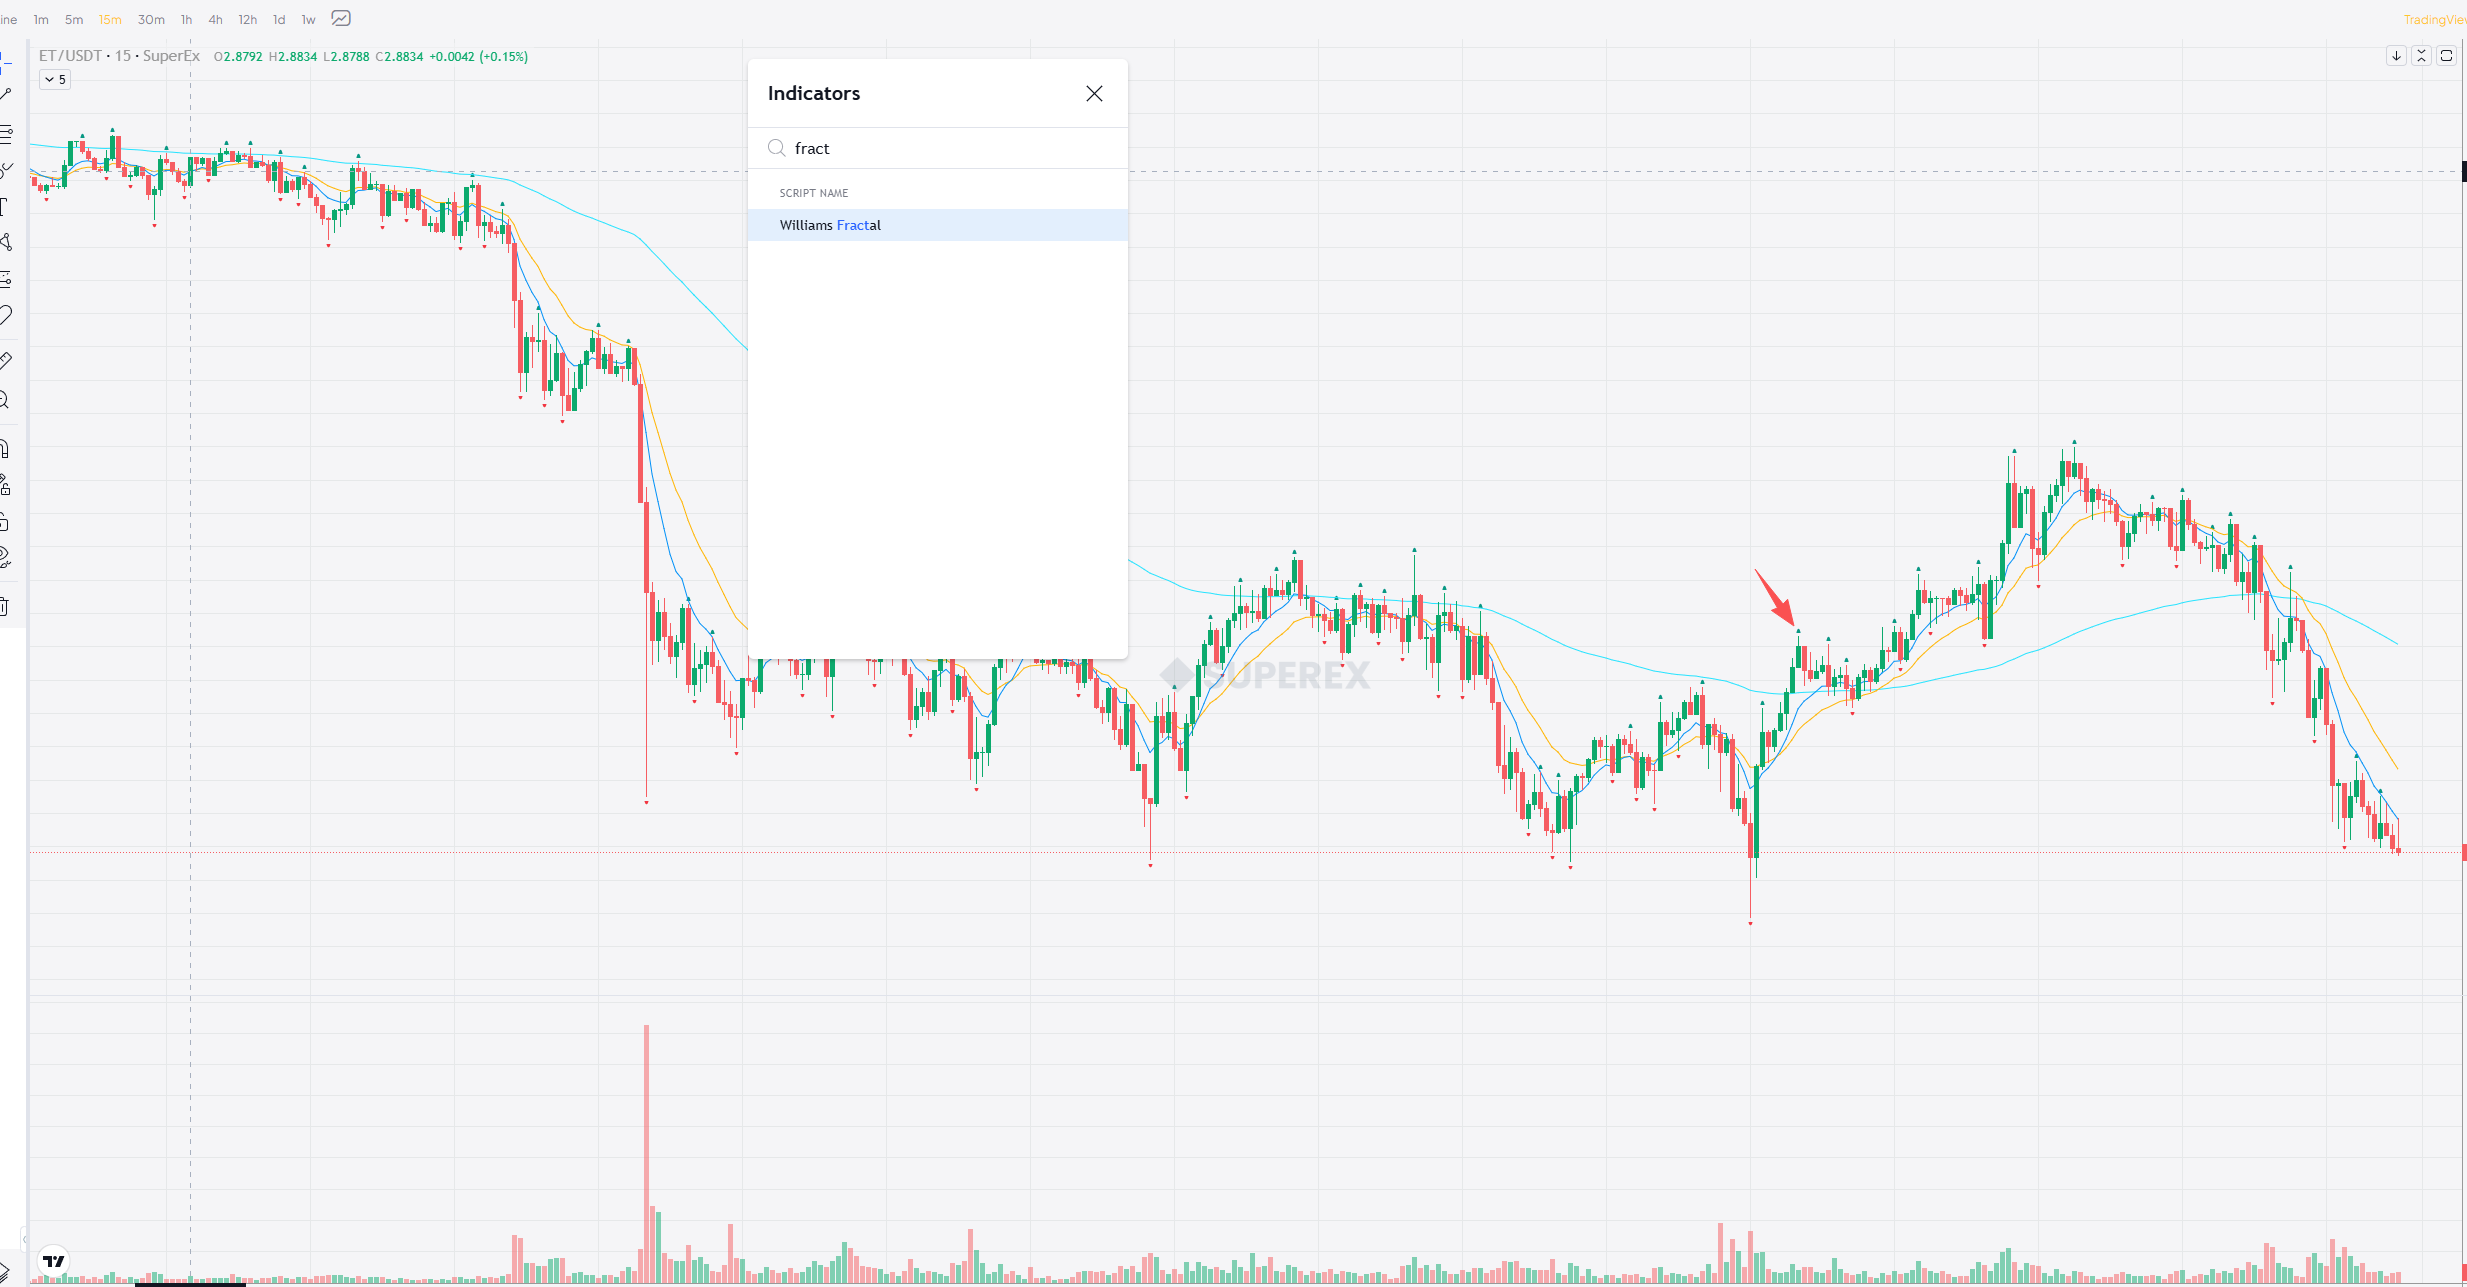
Of course, if this feels too complicated—no worries. SuperEx has built-in charting for the Fractal Indicator. Traders can directly search for “Williams Fractal” in the indicators library to apply it. As shown in the figure below, the green small arrows indicated by the red arrow display the indicator’s pattern:


Responses