LEARN NETWORK VALUE TO TRANSACTIONS RATIO INDEX IN 3 MINUTES BLOCKCHAIN 101
As a market participant, no one wants to face a valuation bubble, as it directly impacts our ability to assess the fair price of an asset. However, there are very few indicators available to measure the valuation bubble ratio of a project, and one of the most effective among them is the Network Value to Transactions Ratio (NVT Ratio). When used correctly, it can be a powerful tool for analysis.
Today, in just three minutes, we will quickly walk you through:
- The basic concept of the NVT indicator
- Its calculation method
- Its practical application in market analysis
This will help you make more rational decisions in digital asset investments and navigate the market with greater confidence.
- Click to register SuperEx
- Click to download the SuperEx APP
- Click to enter SuperEx CMC
- Click to enter SuperEx DAO Academy — Space
![]()
What is the NVT Ratio?
The NVT Ratio (Network Value to Transactions Ratio) is conceptually similar to the Price-to-Earnings Ratio (P/E Ratio) in traditional stock markets. However, instead of using earnings, it substitutes the total transaction volume occurring on a blockchain network.
Specifically, the NVT Ratio is calculated by dividing the total market capitalization (Network Value) of a blockchain network by its total transaction volume (Transactions Value).
How to Interpret the NVT Ratio?
- A high NVT Ratio suggests that the market capitalization of a network is significantly higher than the actual transaction volume, which could indicate overvaluation or speculative behavior.
- A low NVT Ratio may indicate undervaluation or that the network is still in an early growth phase, with room for adoption and expansion.
In simple terms, if the valuation of a blockchain project far exceeds its actual usage (transaction volume), it may signal a market bubble. Conversely, if the ratio is low, it could imply that the asset is undervalued or that the network is still developing its utility.
NVT Ratio Calculation Formula
NVT={Network Value (Total Market Capitalization)}/{Transaction Value (Total On-Chain Transaction Volume)}
For example, suppose a blockchain project has a market capitalization of $10 billion and a total on-chain transaction volume of $1 billion over the past 24 hours. Using the formula:
NVT=10 billion/1 billion=10
If this ratio remains at a consistently high level for multiple days, investors should be cautious and assess whether the network valuation is inflated or driven by speculation.
Significance of the NVT Ratio
The NVT Ratio serves as a valuable market valuation indicator, helping investors assess whether a blockchain network is overvalued or undervalued based on its transaction activity.
1. Market Valuation Reference
As a measure of the ratio between network value and transaction volume, NVT provides investors with a benchmark to gauge whether the market is inflating or underpricing a blockchain project.
2. Network Activity Monitoring
- High transaction volume generally indicates an increase in network activity and adoption.
- If a network has high transaction volume but a relatively low market capitalization, it could suggest that investors have yet to fully recognize its potential.
3. Identifying Investment Timing
- Sudden fluctuations in the NVT Ratio may indicate a sharp shift in market sentiment, signaling possible trend reversals.
- Investors can use these NVT movements as data-driven signals to adjust their positions accordingly.
Practical Applications of the NVT Ratio
The NVT Ratio has become an essential tool for analyzing market trends in major crypto assets like Bitcoin (BTC) and Ethereum (ETH), which have evolved over the years. Investors can use NVT fluctuations to gauge market sentiment and make informed decisions.
1. Identifying Market Bubbles in a Bull Market
- During a bull market, if NVT levels remain excessively high for an extended period, it may indicate an overvalued market driven by speculation.
- Investors can use NVT as a warning signal to mitigate bubble risks and adjust their positions accordingly.
2. Spotting Buying Opportunities in a Bear Market
- In a bear market, a low NVT Ratio may suggest that the asset is undervalued relative to its actual transaction activity.
- This can help investors identify potential accumulation zones before the market rebounds.
3. Assessing the Growth Phase of Emerging Blockchain Projects
- For rapidly growing blockchain projects, NVT can help determine whether the network is in a healthy expansion phase or if the surge in transaction volume is only temporary.
- If NVT remains stable while transaction volumes increase, it may indicate genuine adoption and long-term potential.
- Conversely, if transaction volume spikes but market value does not grow proportionally, it could suggest short-term speculative activity rather than sustainable network growth.
By incorporating the NVT Ratio into their investment strategies, traders and investors can better navigate market cycles, reduce risk exposure, and make data-driven decisions.
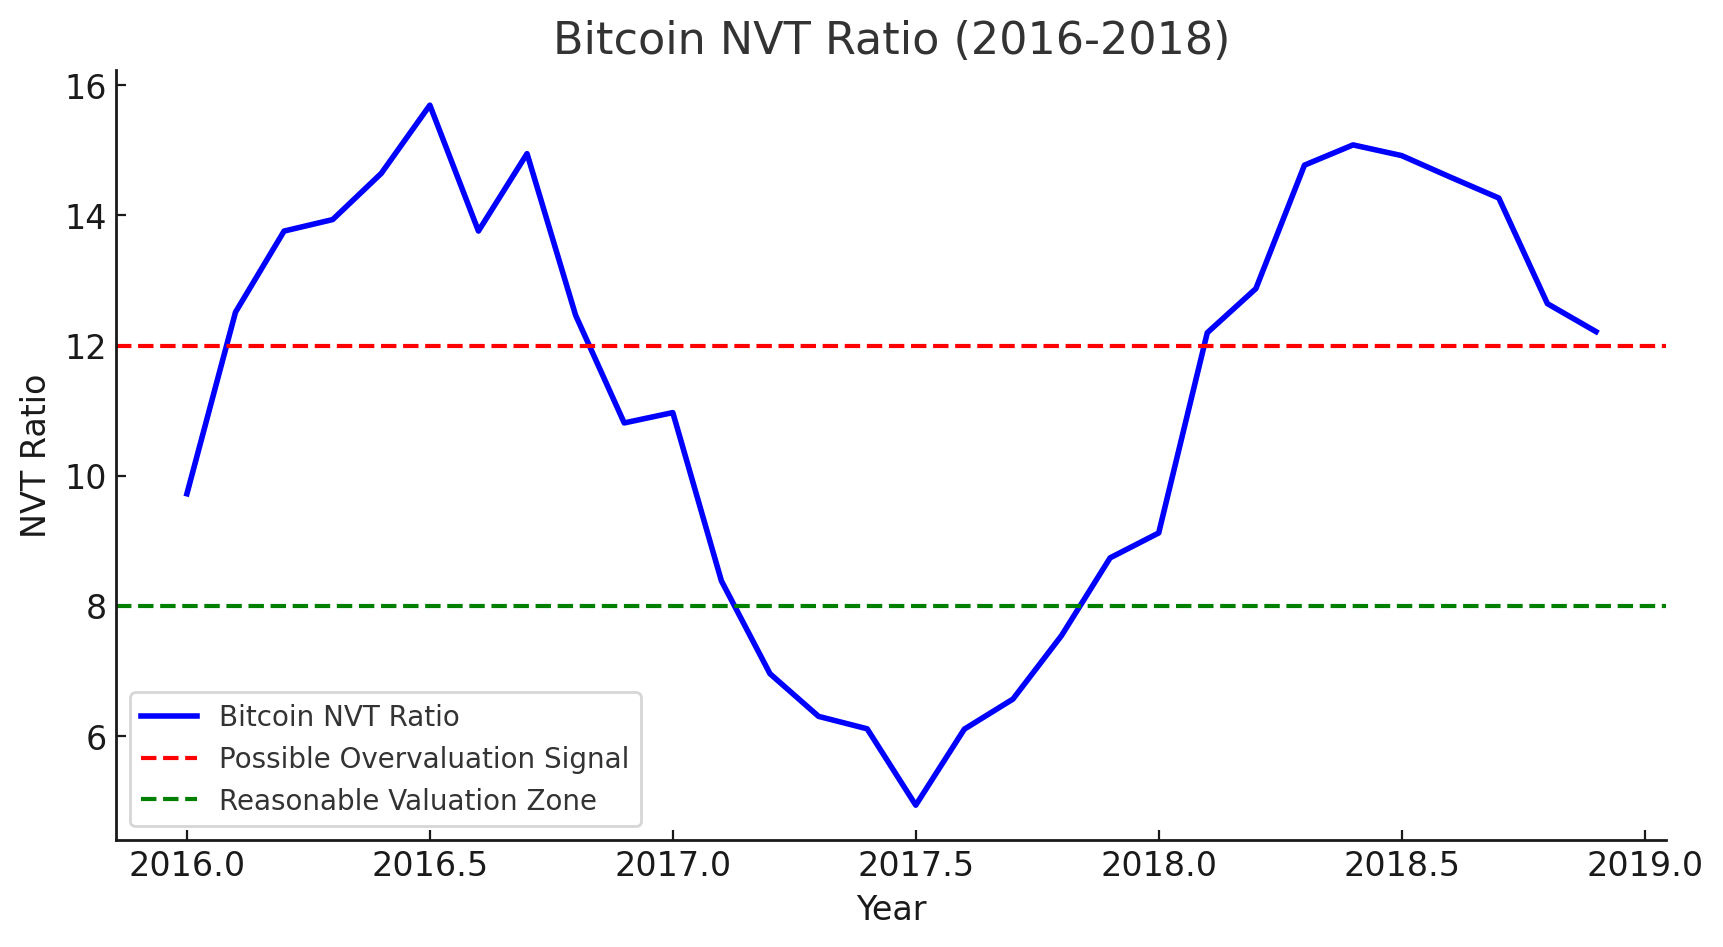
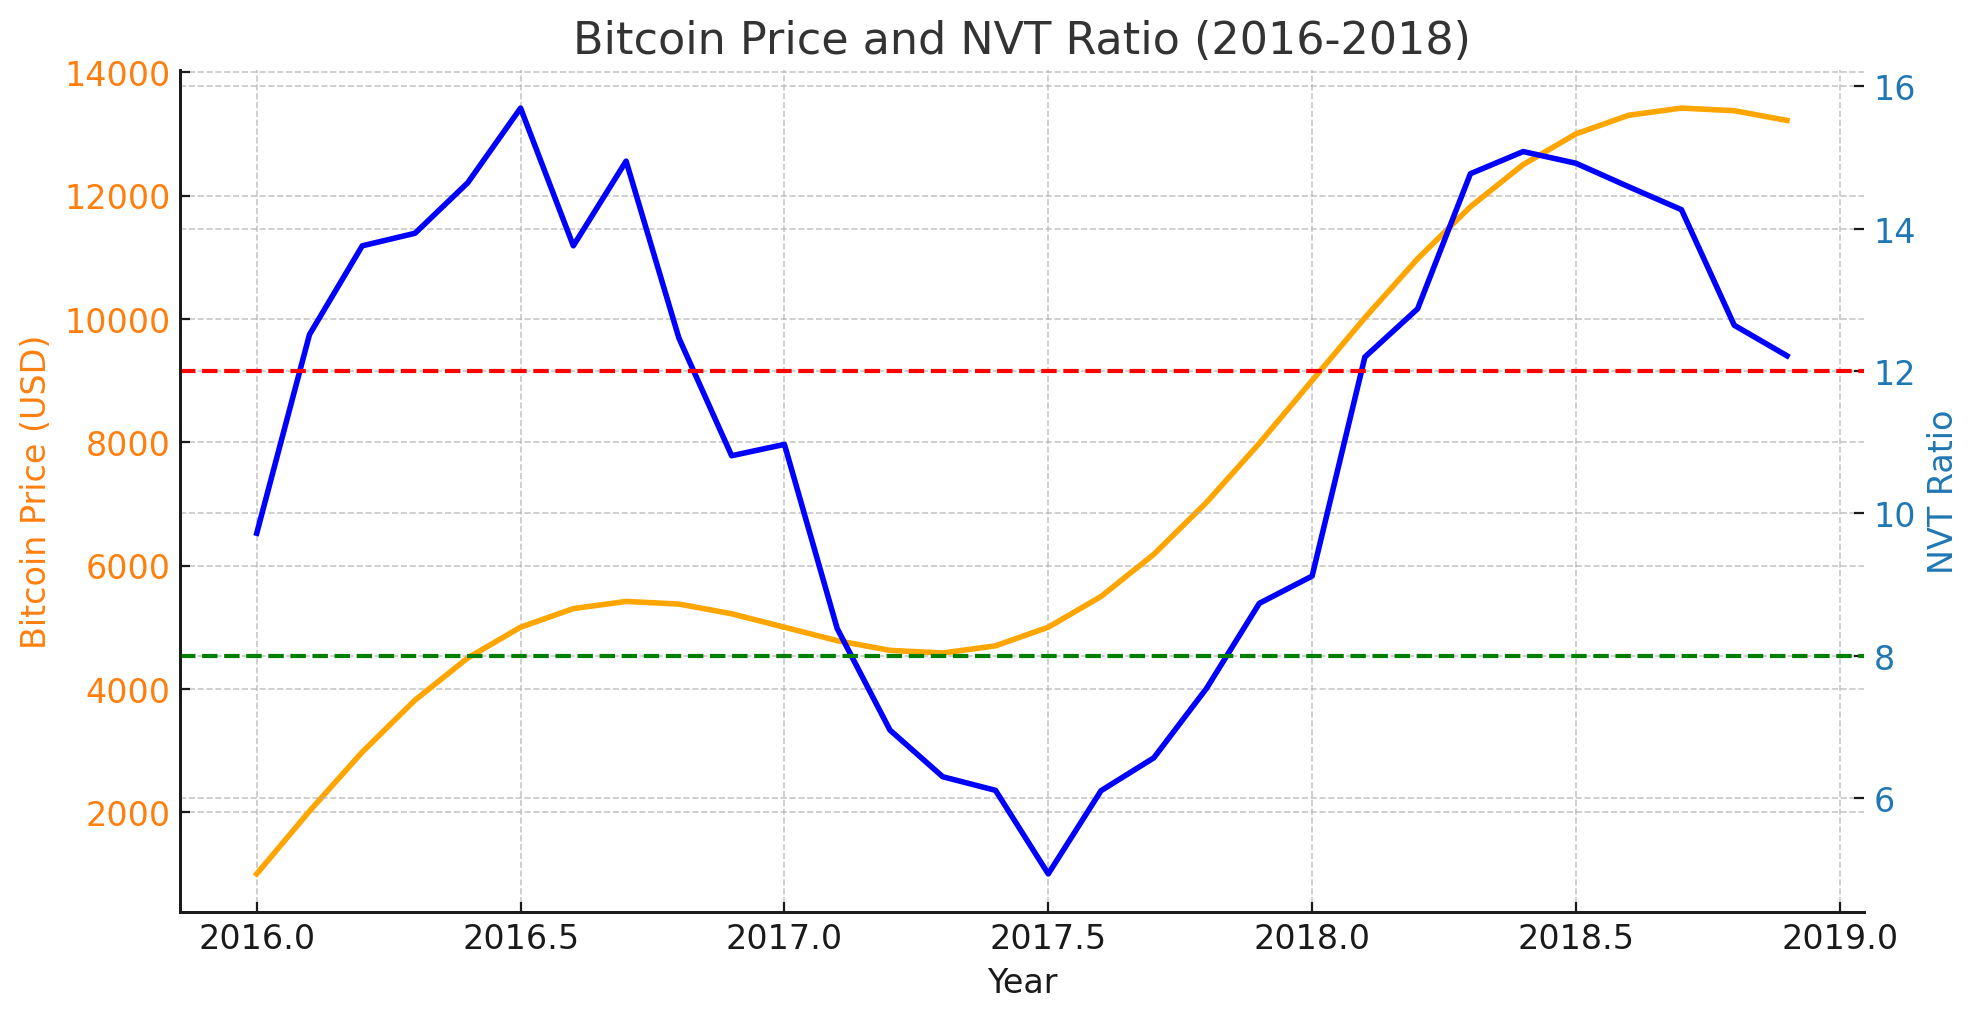
The charts above illustrate Bitcoin’s NVT Ratio and price movements from 2016 to 2018, providing insights into how this indicator correlates with market trends.
Key Observations from the Data:
- During the 2017 bull market, Bitcoin’s NVT Ratio steadily increased, signaling potential overvaluation.
- When NVT surpassed the 12–15 range, some analysts viewed it as a warning sign of a market bubble.
- In early 2018, as Bitcoin’s price corrected sharply, the NVT Ratio also dropped, suggesting that the market was recalibrating to align transaction activity with valuation.
Key Takeaways:
- A high NVT Ratio may indicate speculative market behavior or an overvalued network.
- A declining NVT Ratio following a price correction can help confirm a more realistic valuation.
- Investors should combine NVT with other on-chain metrics, such as active addresses and transaction fees, to form a comprehensive investment strategy.
This real-world case study demonstrates how NVT can be a valuable tool in identifying market turning points and reinforces the importance of multi-factor analysis in blockchain valuation.
Considerations and Limitations
Although the NVT Ratio provides a useful perspective for market analysis, it is not a universal tool.
First, different blockchain projects have vastly different transaction characteristics. Due to their design purposes, some projects may inherently have higher or lower NVT values.
Second, market conditions, transaction fees, and the way on-chain data is collected can also impact the accuracy of the NVT indicator.
Therefore, when using this indicator, it is recommended to combine it with other fundamental data and technical indicators for a multi-dimensional analysis to gain a more comprehensive understanding of market conditions.
Conclusion
Mastering the NVT Ratio can help you better understand the value representation of blockchain networks, while also providing a rational analytical foundation in an ever-changing market.
Whether you are a beginner or an experienced investor, understanding and flexibly applying this indicator will help you gain an edge in the cryptocurrency investment world.


Responses