LEARN NUPL INDEX IN 3 MINUTES BLOCKCHAIN 101

For secondary market participants, the biggest concern is often the FOMO (Fear of Missing Out) or FODA (Fear of Downturn Ahead) sentiments driven by market price fluctuations and a complex mix of internal and external factors. Today, we introduce NUPL (Net Unrealized Profit/Loss)—a key on-chain metric that acts as a spotlight cutting through the fog of uncertainty. By accurately analyzing on-chain data, NUPL reveals the true profit and loss state of market participants.
In this article, we’ll break down NUPL using the latest February 2025 data, providing you with a three-minute guide to this underappreciated but highly effective market sentiment tool.
- Click to register SuperEx
- Click to download the SuperEx APP
- Click to enter SuperEx CMC
- Click to enter SuperEx DAO Academy — Space
The Core Logic of NUPL: Using Math to Decode Greed and Fear
At its core, NUPL directly reflects investor psychology:
- When most investors are in profit, selling pressure intensifies.
- When the majority are at a loss, a market bottom may be near.
NUPL Formula:
NUPL=(TotalUnrealizedProfit−TotalUnrealizedLoss)/MarketCap
- Unrealized Profit: The portion of assets currently valued above their acquisition cost.
- Unrealized Loss: The portion of assets currently valued below their acquisition cost.
Interpreting NUPL Values:
- < 0 → The market is at an overall loss (Extreme Fear).
- 0.25 – 0.50 → Early recovery phase (Cautious Optimism).
- 0.50 – 0.75 → Most investors are profitable (Greed Zone).
- > 0.75 → Extreme greed (Potential Market Top).
If this seems familiar, it’s because many “Fear & Greed Index” calculations are derived from NUPL. This metric is widely cited because it provides actionable market insights.
Real-World Example: Bitcoin’s March 2025 Price Movement
When Bitcoin surged to $95,000, Glassnode reported an NUPL value of 0.82—the highest since 2021. At this point, holders had an average unrealized profit of 68%. Over the next two weeks, Bitcoin retraced 14%, confirming NUPL’s effectiveness as a warning signal.
Four-Stage NUPL Framework for Market Analysis
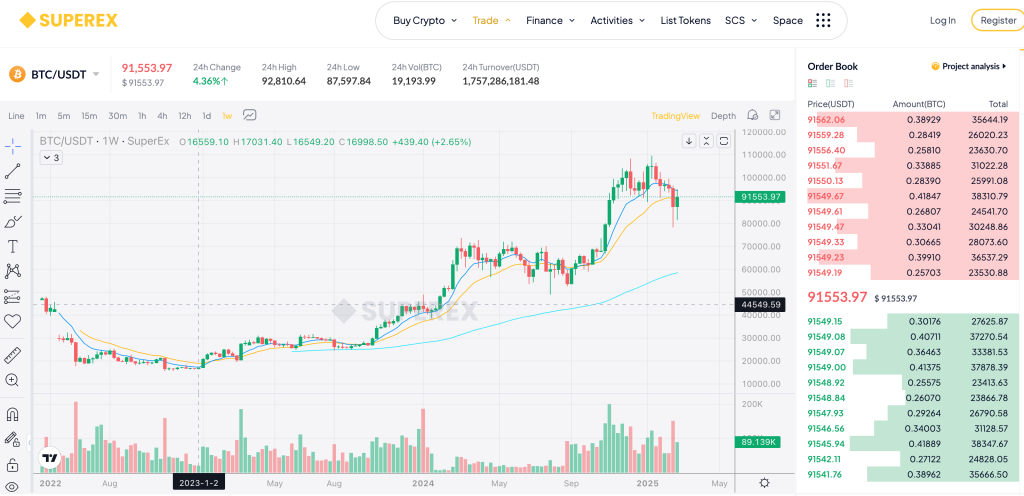
Phase 1: Bottom Formation (NUPL < 0.25)
- At this stage, over 70% of addresses are at a loss, indicating potential reversal opportunities.
- Example: In January 2023, Bitcoin bottomed at $16,500, with NUPL at 0.15. Over the next six months, BTC rallied 210%.
- Actionable Strategy: DCA (Dollar-Cost Averaging)—Gradually accumulate during low NUPL periods.
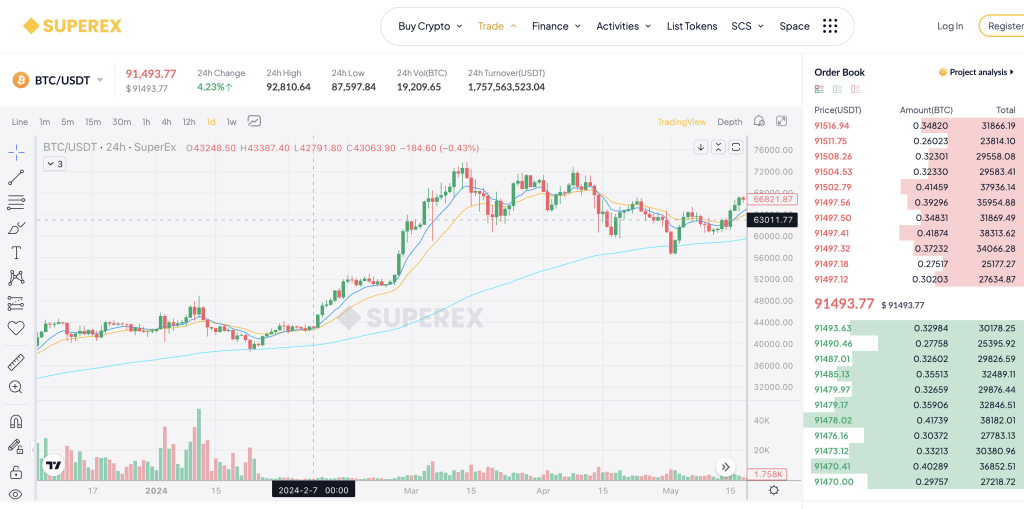
Phase 2: Recovery (NUPL 0.25 – 0.50)
- Profitability exceeds 50%, but investors remain cautious.
- Example: In February 2024, NUPL at 0.38 corresponded to BTC at $42,000. Once BTC broke key resistance levels (e.g., Weekly EMA50), a major bull run followed.
- Actionable Strategy: Look for breakout confirmation and trend continuation signals.
Phase 3: Euphoria (NUPL > 0.75)
- The market enters a danger zone, where FOMO dominates.
- Example: In February 2025, NUPL stayed above 0.75 for 10 consecutive days, while BTC inflows to exchanges spiked by 300%, ultimately triggering a 15% correction.
- Actionable Strategy: Reduce exposure or hedge using options/derivatives.
Phase 4: Death Cross (NUPL Falls Below 0.50 from Highs)
- Confirms a bear market onset.
- Example: During May 2022’s LUNA crash, NUPL collapsed from 0.62 to 0.34 within a week, initiating a 14-month bear cycle.
- Actionable Strategy: Exit high-risk positions or shift to defensive assets.
Cross-Platform Data Validation for NUPL Accuracy
To ensure NUPL’s reliability, compare across three major sources:
- Glassnode → Provides historical percentile analysis (e.g., NUPL at 98th percentile in March 2025).
- CoinMetrics → Enables raw UTXO-based calculations (requires advanced blockchain analytics).
- CryptoQuant → Monitors exchange reserve movements (e.g., NUPL peaks + declining reserves = high risk).
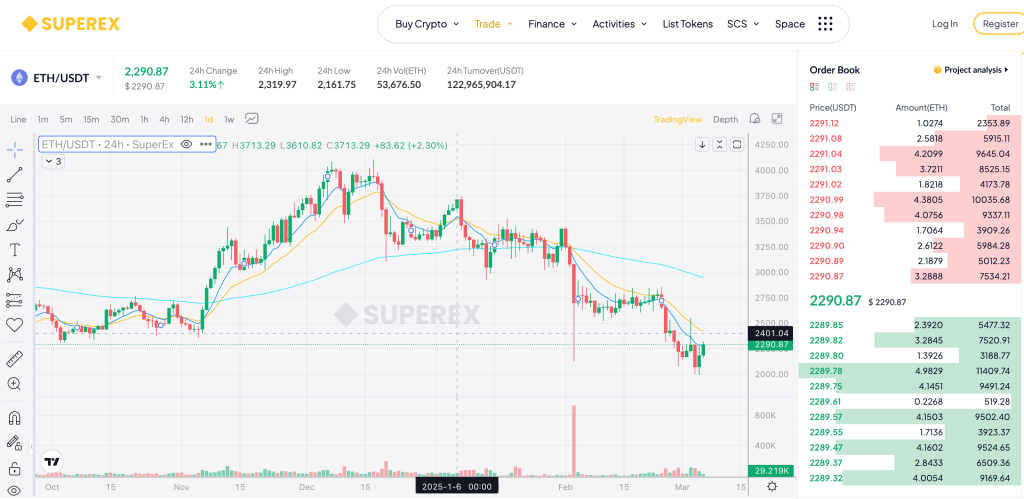
Example: Ethereum’s January 2025 Decline
- Glassnode → NUPL = 0.71.
- CoinMetrics → Unrealized profits at 69%.
- CryptoQuant → Exchange ETH reserves rose 8% (indicating potential sell-offs).
- Outcome: ETH dropped from $3,700 to $2,700.
Advanced Strategy: NUPL’s Synergy with Other Metrics
Single indicators can be misleading—enhance accuracy with multi-metric analysis:
- MVRV Ratio → If NUPL > 0.75 and MVRV > 3.5, 80% probability of a market top.
- Stablecoin Inflows → If NUPL is high but USDT supply growth <5%/month, liquidity may not sustain further gains.
- Options Skew (Put/Call Ratio) → If NUPL signals euphoria and put options premiums exceed 30%, downside risk is confirmed.
Case Study: December 2024 Market Crash
- NUPL = 0.78 (Risk Signal).
- MVRV = 3.8 (Overvaluation).
- USDT growth = 2.1% MoM (Liquidity issue).
- Options Skew Index = 35% (Bearish sentiment dominant).
- Result: BTC crashed 28% in 20 days.
How to Build a NUPL-Based Trading System (3-Step Guide)
Step 1: Identify Market Phase
- Visit Glassnode’s “Profit/Loss” section to check real-time NUPL values.
- Compare against historical quartiles to determine the market cycle phase.
Step 2: Validate Signal Strength
- If NUPL > 0.75, check Coinbase Pro/Binance funding rates (if funding rate > 0.1%, bullish sentiment may be overheated).
- If NUPL < 0, monitor Grayscale Trust premium (widening negative premium often signals market bottoms).
Step 3: Implement a Strategy
- Bullish Strategy → DCA Buy when NUPL < 0.25 (e.g., invest 5% of capital weekly).
- Bearish Strategy → Take profits/Short when NUPL > 0.75 & MVRV > 3.
- Hedging Strategy → Trade volatility ETNs (e.g., Bitcoin Volatility Index) when NUPL is in 0.50 – 0.75 range.
Conclusion: NUPL—A Compass for Navigating Bull & Bear Markets
The real power of NUPL lies in its ability to quantify market psychology into actionable signals.
In March 2025, while many traders were distracted by “Fed rate cuts” and “ETF inflows”, NUPL remained at a cautionary 0.68, warning of potential volatility ahead.
Mastering NUPL could be the key to outperforming the market in the next cycle. 🚀

备份@2x-1024x576.png)

Responses