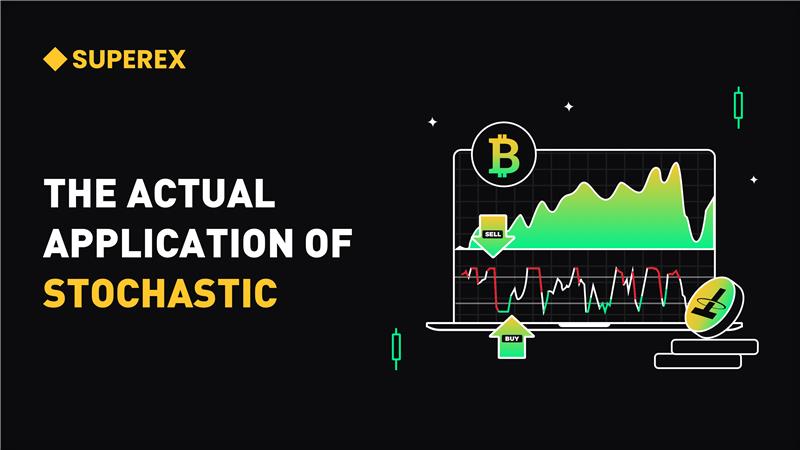
LEARN ULTIMATE OSCILLATOR (UO)INDEX IN 3 MINUTES – BLOCKCHAIN 101

In the crypto market, technical analysis is a fundamental tool that every trader must master. Among the many tools, oscillators are commonly used for analyzing market trends, and they provide signals regarding overbought or oversold conditions. The Ultimate Oscillator (UO), a member of the oscillator family, has attracted significant attention from market analysts and traders due to its unique calculation method and advantages.
This article will delve into the calculation principles, application methods, strengths and weaknesses of the UO indicator, and through practical examples from the crypto market, help readers quickly understand and effectively use the UO indicator.
- Click to register SuperEx
- Click to download the SuperEx APP
- Click to enter SuperEx CMC
- Click to enter SuperEx DAO Academy — Space
UO Indicator Overview: What is the Ultimate Oscillator?
1. Definition and Background
The Ultimate Oscillator (UO) is a technical indicator developed by Larry Williams in 1976. Its primary goal is to combine short-term, medium-term, and long-term price fluctuations to provide a comprehensive reflection of market sentiment. This indicator is particularly useful for a combination of trend trading and reversal trading, helping traders capture key turning points in the market.
2. UO Indicator Calculation Formula
The formula for the UO can be described and broken down as follows:
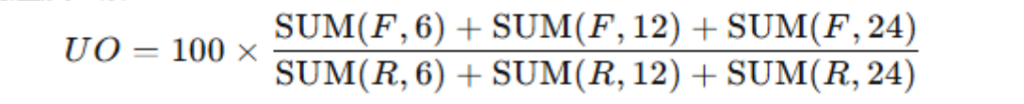
Where F and R represent “True Range” and “Expected Range,” and 6, 12, 24 represent the short-term, medium-term, and long-term periods respectively.
3. Understanding the Core Indicator
The UO provides a smoother oscillator by integrating volatility data across different timeframes, minimizing the market noise caused by a single-period oscillator.
UO Indicator Calculation and Components
1. How to Calculate Each Component of the UO Indicator
- True Range (TR): The true range is the core component of the UO calculation. It reflects the actual market volatility by considering the difference between the high, low, and previous closing price.
- Buying Pressure / Selling Pressure: The expected range is calculated by assessing the buying or selling pressure during price increases or decreases, helping predict potential reversal points in the market.
2. UO Timeframe Selection and Settings
Typically, the standard UO timeframes are 6, 12, and 24 hours. Shorter timeframes are suitable for capturing rapid market fluctuations, while longer timeframes are better for identifying long-term market trends.
How to Use the UO Indicator for Market Analysis
1. UO and Overbought/Oversold Signals
- Overbought Signal: When the UO value is greater than 70, it indicates that the market is overbought, and a price correction may occur.
- Oversold Signal: When the UO value is below 30, it suggests that the market is oversold, and a price rebound may be likely.
2. UO and Price Divergence
Analysis of price divergence with UO: When the price reaches a new high or low, but the UO fails to reach the corresponding high or low, it typically indicates a potential market reversal.
3. UO Combined with Other Indicators
In actual trading, UO is often used in conjunction with other indicators like RSI and MACD. This multi-validation approach increases the accuracy of trading decisions.
Strengths and Weaknesses of the UO Indicator
1. Advantages of the UO Indicator
- Comprehensive Multi-timeframe Analysis: Compared to single-period oscillators, the UO is better at integrating short-term, medium-term, and long-term market volatility, reducing noise signals.
- Applicable in Various Market Environments: The UO can be effectively used in both the volatile crypto market and traditional stock markets, making it a versatile tool.
2. Limitations of the UO Indicator
- Lagging Problem: Like other oscillators, the UO has a lagging nature, especially during extreme market conditions, where it may not quickly reflect sudden price movements.
- Dependence on Market Trends: The UO is better suited for range-bound markets or trend reversals. It may not be reliable for markets with one-sided trends, where traders shouldn’t rely on it solely.
Practical Application of UO Indicator in Crypto Markets
The Ultimate Oscillator (UO) is a technical analysis tool that takes into account short, medium, and long-term market momentum, aiming to provide more accurate overbought and oversold signals. Due to the high volatility and 24-hour nature of the crypto market, the UO is particularly valuable.
Example with Bitcoin (BTC):
Let’s assume that at the beginning of 2024, the price of Bitcoin undergoes a rapid rise from $90,000 to $100,000, and then enters a consolidation phase.
UO Indicator Analysis:
- Overbought Signal: When the price reaches $98,000, the UO indicator surpasses 70, signaling the overbought zone, and the price subsequently corrects.
- Divergence Signal: As the price falls to $95,000, the UO does not reach a new low, forming a bullish divergence, suggesting a potential price reversal.
- Breakout Signal: When the price rises again to $97,000, the UO breaks through its previous high, confirming a buy signal, and the price continues to rise.
Trading Strategy:
- Sell in Overbought Zone: Consider taking profits when the UO enters the overbought zone.
- Buy on Divergence: When a divergence is spotted, consider buying at lower prices.
- Confirm Breakout: Confirm buy signals when the UO breaks through prior highs and increase position size.
Final Thoughts
As the crypto market matures, the UO indicator may face challenges from more advanced technical tools. However, it remains a foundational and effective tool for market analysis. In the future, with the continued advancements in artificial intelligence and machine learning, the UO could potentially be combined with more advanced algorithms, further enhancing its applicability and predictive power in the crypto market.
By gaining a deep understanding and applying the UO indicator, traders can better grasp market dynamics and develop more effective trading strategies.


Responses