LEARN ON-BALANCE VOLUME (OBV) INDEX IN 3 MINUTES – BLOCKCHAIN 101

Among these, the On-Balance Volume (OBV) Index is one of the most popular tools for measuring market sentiment and predicting price trends based on trading volume. Whether you’re a seasoned trader or just starting out, understanding OBV can provide valuable insights into the underlying forces driving price movements. In this article, we’ll break down the OBV Index, explain how it works, and show you how to use it effectively for your trading strategy. By the end, you’ll be able to understand OBV in just three minutes!

What is On-Balance Volume (OBV)?
The On-Balance Volume (OBV) Index is a momentum-based indicator that uses volume flow to predict changes in stock price. Created by Joe Granville in 1963, OBV is designed to measure the cumulative buying and selling pressure by adding or subtracting volume based on the direction of the price movement. Simply put, OBV relates volume to price: when the price closes higher than the previous close, the volume is added to the OBV, and when the price closes lower, the volume is subtracted.
OBV is calculated using the following simple formula:
- If today’s close is higher than yesterday’s close:
OBV = Previous OBV + Today’s Volume
- If today’s close is lower than yesterday’s close:
OBV = Previous OBV – Today’s Volume
- If today’s close is the same as yesterday’s close:
OBV = Previous OBV
The value of OBV continuously changes as new price and volume data come in, helping traders identify trends, reversals, and momentum in the market.
How Does OBV Work?
The primary concept behind OBV is that volume precedes price. According to Granville’s theory, price changes tend to follow volume changes, as volume reflects the strength or weakness of a price move. A rising OBV indicates that there is strong buying pressure in the market, and a falling OBV suggests increasing selling pressure.
Here’s how OBV is typically used:
- Identifying Trend Strength:
OBV helps traders understand the strength of a price trend. If the price of an asset is rising, and OBV is also increasing, it indicates that the upward trend is backed by strong buying volume, suggesting that the trend may continue. Conversely, if OBV is decreasing while the price is rising, it indicates that the upward trend is not supported by buying pressure and could be weak or unsustainable.
- Spotting Divergence:
Divergence occurs when the price and OBV move in opposite directions. For example, if the price is making new highs, but OBV is not following suit (i.e., it’s either stagnating or decreasing), it could signal that the trend is losing strength, and a reversal may be imminent. Divergence is often used as a signal for potential trend reversals and is one of the most powerful applications of OBV.
- Confirming Breakouts:
OBV is often used to confirm price breakouts. When the price breaks through a key resistance or support level, and OBV moves in the same direction, it confirms that the breakout is supported by volume, increasing the likelihood of a sustained price move. On the other hand, if the price breaks out without OBV confirmation, it may suggest that the breakout is weak and could fail.

Using OBV in Different Market Conditions
OBV can be a highly effective tool in various market conditions. Below, we’ll discuss how to use OBV in both trending and ranging markets.
- OBV in Trending Markets
In a trending market, OBV works best when used in conjunction with price action to confirm the trend’s strength. When prices are moving in a strong upward or downward trend, OBV will often follow the price trend. Traders should look for the following signals:
- Bullish Trend:
If OBV is rising along with the price, this is a strong bullish confirmation. The increasing OBV indicates that buying pressure is high, supporting the rising price. A trader would typically consider buying in such a scenario.
- Bearish Trend:
Conversely, if OBV is declining as the price moves lower, it indicates strong selling pressure and confirms the bearish trend. Traders looking for shorting opportunities should consider entering the market when OBV confirms the downtrend.
- OBV in Range-Bound Markets
In a ranging market, OBV can help traders identify potential breakouts or breakdowns. When the price is moving sideways, and OBV is showing increasing volume during price consolidations, it could indicate that the market is preparing for a breakout. If OBV starts to rise during an upward price movement or fall during a downward price movement, it’s a signal that the breakout is supported by strong volume and has a higher probability of success.
In range-bound markets, pay close attention to OBV’s reaction to key support and resistance levels. If OBV moves decisively beyond a key level, it often signals that a breakout is likely, and traders should be prepared to enter in the direction of the breakout.
How to Use OBV with Other Indicators
While OBV is a powerful tool on its own, it is often more effective when combined with other technical indicators. Here are a few popular indicators that work well with OBV:
- Moving Averages
By combining OBV with moving averages, traders can gain an additional layer of confirmation. For example, using a 50-day or 200-day moving average of OBV can help smooth out fluctuations and highlight longer-term trends. A rising OBV above a moving average signals sustained bullish pressure, while a declining OBV below a moving average points to sustained bearish pressure.
- Relative Strength Index (RSI)
The Relative Strength Index (RSI) is a momentum oscillator that measures the speed and change of price movements. By combining OBV with RSI, traders can gain deeper insight into market conditions. For example, if the OBV is rising, but RSI is showing overbought conditions, it could signal that the price is set for a reversal despite the OBV showing strong buying pressure.
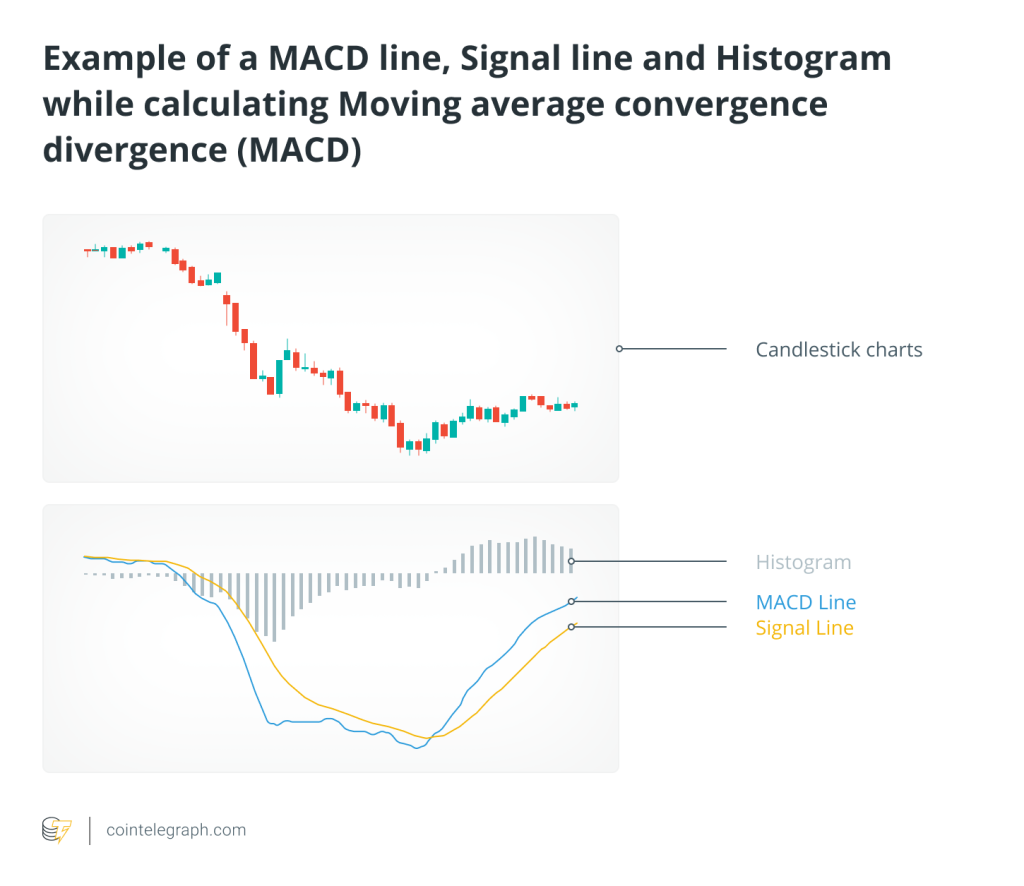
- MACD (Moving Average Convergence Divergence)
MACD is another momentum-based indicator that helps traders identify trend direction and momentum. Combining OBV with MACD allows traders to confirm buy or sell signals. If OBV is rising and MACD shows a bullish crossover, it increases the confidence that the trend will continue.
Common Mistakes When Using OBV
Like any technical indicator, OBV is not infallible, and traders should be aware of common pitfalls when using it. Here are some mistakes to avoid:
- Over-relying on OBV Alone:
OBV should not be used in isolation. Always confirm OBV signals with other technical indicators to reduce the risk of false signals.
- Ignoring Volume Trend:
OBV is driven by volume, so it’s crucial to pay attention to volume trends. If volume is low, OBV signals might not be as reliable, and traders should exercise caution.
- Misreading Divergences:
Divergence is a powerful signal, but it’s essential to confirm it with other indicators. Sometimes, price and OBV divergence might be a temporary anomaly and not necessarily signal an immediate reversal.
Conclusion
The On-Balance Volume (OBV) Index is a simple yet powerful tool that can help traders assess market sentiment, identify trends, and predict potential price movements based on volume flow. By understanding how OBV works, how to use it in different market conditions, and how to combine it with other indicators, traders can enhance their ability to make informed decisions.
Whether you’re trading stocks, cryptocurrencies, or any other asset, OBV can give you insights into the market’s underlying strength, offering a unique edge in your trading strategy. However, as with any technical analysis tool, it’s important to remember that no indicator is foolproof. Always use OBV as part of a broader strategy, including proper risk management, to ensure successful trading outcomes.
With this comprehensive understanding of the OBV Index, you’re now equipped to incorporate it into your trading toolkit and use it to enhance your market analysis. Happy trading!


Responses