Why is XRP price up today?
XRP’s price has gained over 11.50% in the past 24 hours amid large withdrawals from crypto exchanges.

The price of XRP (XRP) is up today, rising approximately 11.50% in the last 24 hours to $0.68. At its intraday best, the cryptocurrency was trading for as high as $0.74, its highest level since November 2023.

Let’s discuss the core factors contributing to the XRP price rally today.
XRP whale activity, crypto exchange withdrawals
XRP’s price gains today appear after massive capital transfers from crypto exchanges.
Notably, on March 8, an anonymous entity withdrew 300 million XRP worth over $187.13 million from Binance, according to data resource Whale Alert.

Similar outbound transactions worth $18-19 million occurred afterward, indicating that XRP’s richest investors want to hold their tokens instead of trading them on exchanges for other assets.
That is further visible in the whale data from Messari. It shows that the number of addresses with a balance of over 1 million XRP has increased during the ongoing price rally.

This data suggests that large crypto investors are behind the current XRP price gains, which typically bodes well for more upside.
Capital rotation from Bitcoin markets
In addition, XRP’s price gain today appears alongside a sharp rebound versus Bitcoin (BTC) as well.
Related: XRP has disappointed vs. Bitcoin in 2024 — Is a price rebound possible?
Notably, the XRP/BTC pair has jumped by over 12% a day after dropping to 0.00000859 BTC, its lowest level since March 2021. This rebound shows some risk-on traders rotating from Bitcoin and into altcoins for greater profit potential in the short term.

Traders also rotate capital to reduce their risk exposure in overbought assets. Bitcoin, despite its 72.5% rise so far in 2024, remains “overbought” on the daily timeframe chart.

In comparison, XRP’s daily relative strength index (RSI) remains within the neutral range of 30-70, demonstrating a balanced sentiment among investors. This technically indicates that XRP could have more room to rise against the rally-leading BTC.
XRP price technical rebound
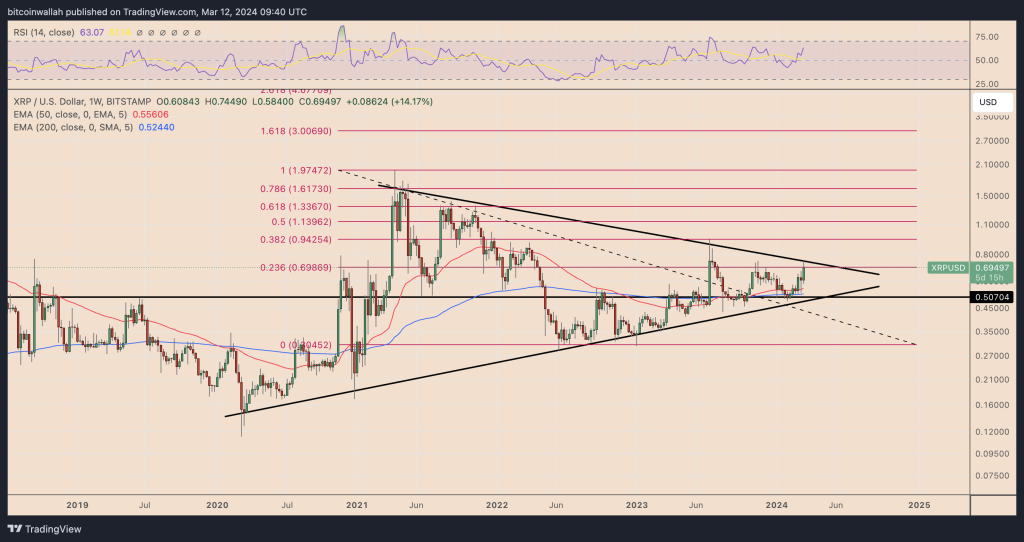
From a technical analysis perspective, XRP’s price gains have emerged out of a support confluence area.
This confluence comprises XRP’s ascending trendline, 50-day exponential moving average (50-day EMAl the blue wave) at $0.58, and 0.382 Fibonacci retracement line near $0.59. These support levels resemble a fractal in November 2023 that preceded a 21.25% price rally.

So XRP price will eye a close above the multi-year descending trendline resistance to sustain its uptrend toward its popular target of $1. Conversely, a routine pullback from the resistance might resulting a drop of 20% toward its ascending trendline support near $0.50.

In this bearish scenario, the downside target is near XRP’s 50-week (the red wave) and 20-week (the blue wave) EMAs.
This article does not contain investment advice or recommendations. Every investment and trading move involves risk, and readers should conduct their own research when making a decision.

Responses