Price analysis 2/5: SPX, DXY, BTC, ETH, BNB, SOL, XRP, ADA, AVAX, DOGE
Bitcoin price is range bound, and even though altcoins are rallying, the strong U.S. dollar could act as a significant barrier.

Stock markets in the United States continued their march higher last week, even after the Federal Reserve Chair Jerome Powell dashed hopes of a rate cut in March. However, Powell did say that a rate cut would likely happen this year. Powell reiterated these views during his interview with CBS news show 60 Minutes.
Fed comments and strong macroeconomic data reduced expectations of rate cuts by the Fed to 120 basis points in 2024, down from 150 basis points at the end of last year, Fed funds futures showed. This pushed the U.S. dollar Index (DXY) to its highest level in 11 weeks.

Historically, Bitcoin (BTC) moves in inverse correlation with the U.S. dollar. Hence the strength in the greenback could act as a headwind for Bitcoin in the near term. A minor positive in favor of the bulls is the strong inflows into BlackRock and Fidelity’s spot Bitcoin exchange-traded funds (ETFs) in January, totaling about $4.8 billion. Continued inflows into the ETFs could limit the downside.
Will Bitcoin remain stuck in a range, or is a breakout on the cards? How are the altcoins expected to behave? Let’s analyze the charts to find out.
S&P 500 Index price analysis
The S&P 500 Index rebounded off the 20-day exponential moving average (4,850) on Feb. 1 and soared to a new all-time high on Feb. 2.

Both moving averages are sloping up, indicating that the bulls are in command, but the negative divergence on the relative strength index (RSI) warrants caution. The up move could face selling at the psychological resistance of 5,000, but if buyers bulldoze their way through, the next stop could be 5,200.
The crucial support on the downside is the 20-day EMA. A slide below this level will be the first indication that the bulls are rushing to the exit. That may start a fall to the 50-day simple moving average (4,734) and then to 4,650.
U.S. dollar Index price analysis
The U.S. dollar Index snapped back sharply from the 50-day SMA (102.84) on Feb. 2 and broke above the neckline of the inverted head-and-shoulders pattern.

The pattern target of the bullish setup is 107.39, just below the formidable overhead resistance at 108. However, the bears are unlikely to give up easily. They will try to halt the up move near 104.55 and again at 106.
If bears want to make a comeback, they will have to tug the price below the 50-day SMA to seize control. The index may decline to the vital support zone between 101 and 99.57. The bulls are expected to defend this zone with all their might.
Bitcoin price analysis
The bears have failed to sink Bitcoin below the 20-day EMA ($42,463) even after repeated attempts, suggesting that the bulls are fiercely defending the level.

Buyers will try to push the price to the $44,000 to $44,700 overhead resistance zone. This remains the key zone for the bears to defend because if they fail in their endeavor, the BTC/USDT pair could skyrocket to the psychological level of $50,000.
On the other hand, if the price turns down from $44,700, the pair may consolidate in a tight range for a while. The bears will be on top if they sink the pair below $41,394. The pair may then slide to $40,000 and eventually to $37,980.
Ether price analysis
Ether (ETH) has been trading below the moving averages for several days, but the bears have failed to pull the price to the strong support at $2,100. This suggests buying at lower levels.

The bulls are trying to push the price above the moving averages. If they do that, the ETH/USDT pair could challenge the $2,400 level. A break and close above this resistance will indicate that bulls have overpowered the bears. The pair may rise to $2,600 and then to the Jan. 12 intraday high of $2,717.
Conversely, if the price turns down from the overhead resistance, it will signal that the bears are active at higher levels. That may keep the pair stuck inside the $2,100 to $2,400 range for some more time.
BNB price analysis
BNB (BNB) bounced off the 50-day SMA ($300) on Feb. 4, but the bulls are struggling to build upon the strength.

Buyers will have to clear the overhead hurdle at the downtrend line to invalidate the descending triangle pattern. If they succeed, the BNB/USDT pair could rally to $320 and subsequently to $338.
Contrary to this assumption, if the price turns down and breaks below the 50-day SMA, it will indicate that the bears continue to sell on minor rallies. The pair may then drop to the strong support at $288. If this level crumbles, the pair will complete the bearish setup, which could start a down move to $260.
XRP price analysis
The bears could not maintain XRP (XRP) below $0.50 on Jan. 31 and Feb. 1, which started a recovery to the 20-day EMA ($0.53) on Feb. 3.

The price turned down from the 20-day EMA on Feb. 4, indicating that the sentiment remains negative and traders are selling on rallies. If the $0.50 support gives way, the XRP/USDT pair could plunge to $0.46.
Contrarily, if the price turns up from the current level and breaks above the 20-day EMA, it will suggest that the bulls are vigorously defending the $0.50 support. The positive divergence on the RSI also points toward a recovery in the near term. If buyers kick the price above the 20-day EMA, the pair may attempt a rally to the downtrend line.
Solana price analysis
Solana (SOL) is witnessing a tough battle between the bulls and the bears near the moving averages.

The price action of the past few days is forming an inverse H&S pattern, which will complete on a break and close above $107. This bullish setup has a target objective of $125. There is a minor resistance at $117, but it is likely to be crossed.
Alternatively, if the price breaks and maintains below the moving averages, it will signal that the bulls have given up. The SOL/USDT pair may start a descent to $79, which is an important level for the bulls to guard, because if it cracks, the next stop may be $64.
Related: BTC price sets new February high as Bitcoin buyers target faraway $25K
Cardano price analysis
Cardano (ADA) has been hovering near the 20-day EMA ($0.50) for the past few days, indicating indecision between the bulls and the bears.

The 20-day EMA has flattened out, and the RSI is just below the midpoint, suggesting a range-bound action in the near term. If buyers drive the price above the 20-day EMA, the ADA/USDT pair could rise to the downtrend line. The bulls will have to overcome this obstacle to signal a potential trend change in the near term.
On the downside, if the price breaks below $0.48, it will indicate that bears are trying to gain the upper hand. The pair may slide to $0.46 and later to the channel’s support line.
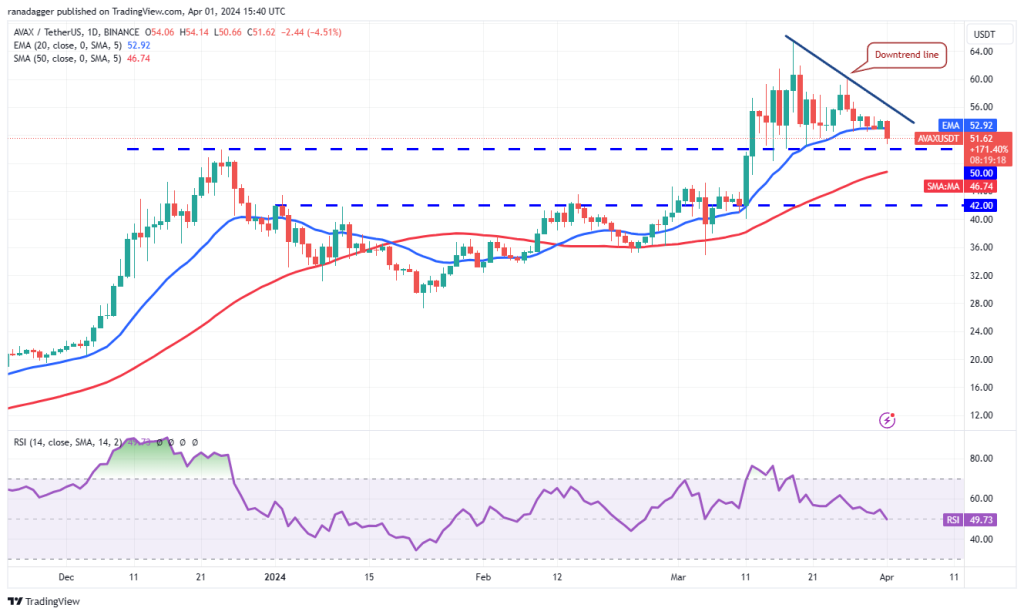
Avalanche price analysis
Avalanche (AVAX) reversed direction from the downtrend line on Feb. 3, but a positive sign is that the bulls are attempting to defend the 20-day EMA ($34.55).

If the price turns up from the current level, it will increase the likelihood of a break above the descending channel. If that happens, the AVAX/USDT pair could climb to $44 and thereafter attempt a rally to the psychologically important level of $50.
If bears want to prevent the upward move, they will have to quickly yank the price below the immediate support at $32. If they do that, the pair could slump toward the channel’s support line near $24.
Dogecoin price analysis
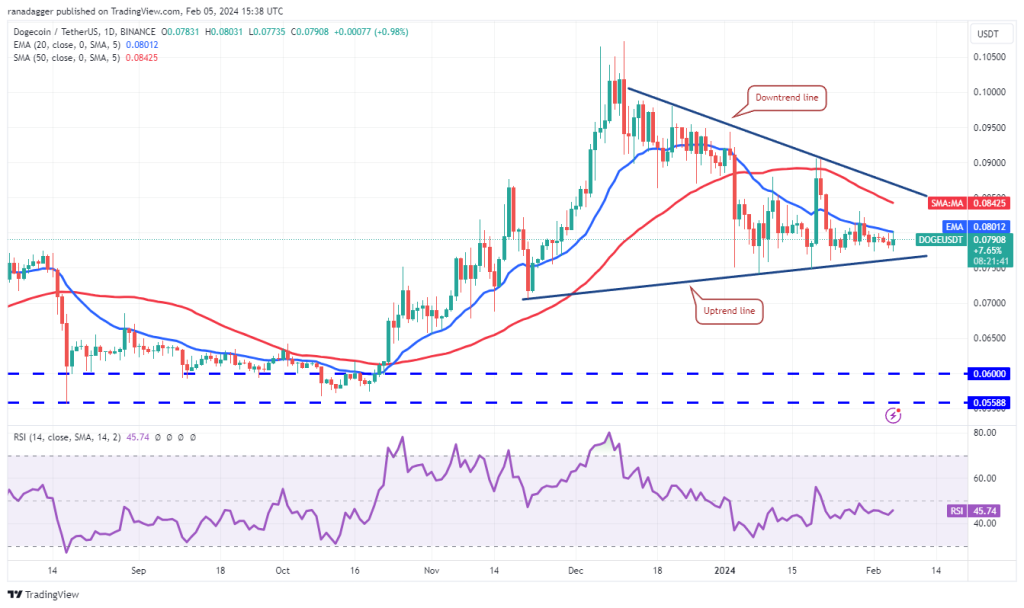
Dogecoin (DOGE) continues to trade below the 20-day EMA ($0.08), but the bulls have not allowed the price to dip below the uptrend line of the symmetrical triangle pattern.

If the price turns up and breaks above the 20-day EMA, it will indicate that the DOGE/USDT pair may extend its stay inside the triangle for a few more days. The pair will try to rise to the downtrend line.
The next trending move is likely to begin on a break above or below the triangle. If the price surges above the triangle, the pair could travel to the $0.10 to $0.11 resistance zone. On the contrary, a break below the triangle will open the doors for a fall to $0.07 and then $0.06.


… [Trackback]
[…] Find More here to that Topic: x.superex.com/news/ethereum/4148/ […]
… [Trackback]
[…] Find More Info here to that Topic: x.superex.com/news/ethereum/4148/ […]
… [Trackback]
[…] Read More to that Topic: x.superex.com/news/ethereum/4148/ […]
… [Trackback]
[…] Read More on that Topic: x.superex.com/news/ethereum/4148/ […]
… [Trackback]
[…] Read More to that Topic: x.superex.com/news/ethereum/4148/ […]
… [Trackback]
[…] There you can find 65434 more Information to that Topic: x.superex.com/news/ethereum/4148/ […]
… [Trackback]
[…] Info on that Topic: x.superex.com/news/ethereum/4148/ […]
… [Trackback]
[…] Here you will find 8996 additional Information on that Topic: x.superex.com/news/ethereum/4148/ […]
… [Trackback]
[…] Find More on that Topic: x.superex.com/news/ethereum/4148/ […]
… [Trackback]
[…] Read More on that Topic: x.superex.com/news/ethereum/4148/ […]
… [Trackback]
[…] Info to that Topic: x.superex.com/news/ethereum/4148/ […]
… [Trackback]
[…] Information on that Topic: x.superex.com/news/ethereum/4148/ […]
… [Trackback]
[…] Read More Information here on that Topic: x.superex.com/news/ethereum/4148/ […]
… [Trackback]
[…] Find More Info here to that Topic: x.superex.com/news/ethereum/4148/ […]
… [Trackback]
[…] Here you will find 7601 additional Information to that Topic: x.superex.com/news/ethereum/4148/ […]
… [Trackback]
[…] Here you will find 37323 more Information on that Topic: x.superex.com/news/ethereum/4148/ […]
… [Trackback]
[…] Read More on that Topic: x.superex.com/news/ethereum/4148/ […]
… [Trackback]
[…] Info on that Topic: x.superex.com/news/ethereum/4148/ […]
… [Trackback]
[…] Find More Information here to that Topic: x.superex.com/news/ethereum/4148/ […]
… [Trackback]
[…] Find More Information here on that Topic: x.superex.com/news/ethereum/4148/ […]
… [Trackback]
[…] Info to that Topic: x.superex.com/news/ethereum/4148/ […]
… [Trackback]
[…] Read More on that Topic: x.superex.com/news/ethereum/4148/ […]
… [Trackback]
[…] Find More on that Topic: x.superex.com/news/ethereum/4148/ […]
… [Trackback]
[…] Find More Information here on that Topic: x.superex.com/news/ethereum/4148/ […]
… [Trackback]
[…] Read More Info here to that Topic: x.superex.com/news/ethereum/4148/ […]
… [Trackback]
[…] There you will find 4543 additional Information on that Topic: x.superex.com/news/ethereum/4148/ […]
… [Trackback]
[…] Here you will find 75336 more Info to that Topic: x.superex.com/news/ethereum/4148/ […]
… [Trackback]
[…] Find More to that Topic: x.superex.com/news/ethereum/4148/ […]