
SuperEx Educational Series: Understanding What Hidden Costs Do Traders Actually Pay

#SuperEx #EducationalSeries
In the previous article, we discussed how much buying and selling pressure a market can actually absorb. But there is a second half to that question: if the market cannot absorb the pressure, where does the remaining pressure go?
It usually does not disappear. It becomes a cost paid by the trader.
Many traders check the fee rate before placing an order. If the screen shows 0.1%, the calculation feels simple: a 10,000 USDT trade should cost about 10 USDT. Then the order fills 2% above the displayed price, withdrawal adds another charge, moving funds on-chain consumes gas, and the perpetual position later pays funding.
You thought you were simply buying an asset. The final bill looks more like a food-delivery receipt: the product is affordable, while delivery, packaging, service, and distance charges form an impressive little queue.
That is why trading costs are so often underestimated. The trading interface lists certain fees, but the market does not automatically print a complete receipt.
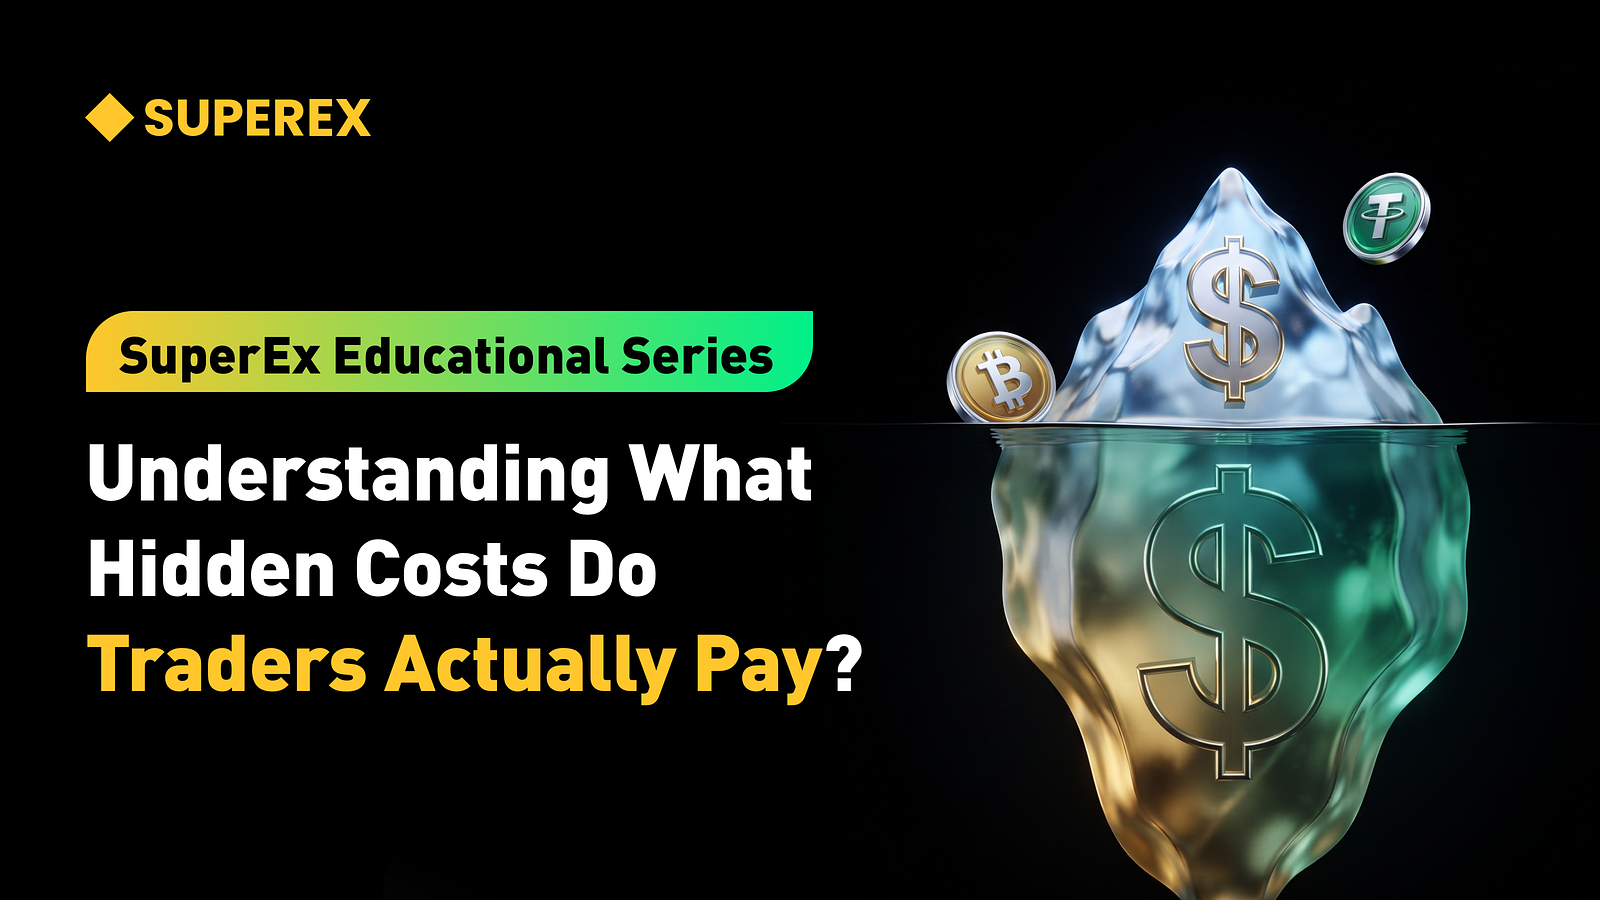
Trading Cost Is More Than the Published Fee
Trading costs can be divided into two broad categories.
The first category is explicit cost: charges directly disclosed by an exchange, protocol, or network. These include spot trading fees, futures maker and taker fees, withdrawal fees, borrowing interest, blockchain gas fees, and perpetual funding payments.
The second category is implicit cost. It may never appear under the label “fee.” Instead, it is embedded in execution prices, timing, and market structure. Examples include bid-ask spread, slippage, price impact, non-execution cost, on-chain MEV, and losses created by forced liquidation during volatile conditions.
Therefore, the real cost of a trade should not be measured only by the published fee rate. It should compare:
- How much value you should have received at a reasonable benchmark price;
- How much value you actually received after execution and all charges;
- How much would remain if you sold, transferred, or closed the position.
The gap between these figures is much closer to the true all-in trading cost.
The benchmark itself matters. Many traders treat the latest displayed price as the price available to them. But the last price only shows where the previous trade occurred. It does not guarantee that the market will absorb the trader’s full order at that level.
In other words, a chart tells you what just happened. The order book is closer to telling you what may happen if you trade now.
The Most Common Hidden Costs Are Embedded in Execution
Let us begin with the bid-ask spread.
Suppose a token’s highest bid is 0.99 USDT and its lowest ask is 1.01 USDT. A market buy begins near 1.01 USDT. If you immediately sell, execution begins near 0.99 USDT.
Even if the token’s market value does not change at all, the round trip already loses close to 2%, before trading fees are included.
This is spread cost. When liquidity is deep and market makers compete actively, spreads are generally narrower. When liquidity is thin, liquidity providers face more inventory and price risk, so spreads tend to widen.
Next come slippage and price impact.
Suppose a token is displayed at 1 USDT, but the actual sell-side order book looks like this:
- 5,000 tokens are available at 1.00 USDT;
- 10,000 tokens are available at 1.02 USDT;
- 20,000 tokens are available at 1.05 USDT;
Meaningful additional supply does not appear until 1.10 USDT.
A purchase of 1,000 tokens may execute near 1 USDT. A purchase of 30,000 tokens consumes several price levels, making the average execution price meaningfully higher.
If the final average execution price is 1.04 USDT, the trader pays roughly 1,200 USDT more than the 1 USDT benchmark. Even with a 0.1% trading fee, the explicit fee would be only about 30 USDT. The much larger cost comes from price impact.
This is why a low-fee platform is not automatically a low-cost market. If the market has weak depth, wide spreads, and large gaps between price levels, the fee savings may be handed back through slippage within seconds.
The difference between market and limit orders can also be understood through cost.
A market order prioritizes execution but does not guarantee the final price. A limit order controls the worst acceptable price but does not guarantee execution.
The trader is therefore choosing between two types of cost: immediate execution may create slippage, while waiting for a better price may result in non-execution, missed opportunities, or further adverse price movement.
Neither order type is always superior. The real question is whether price uncertainty or execution uncertainty is more costly for your situation.
On-Chain and Derivatives Trading Add More Layers of Cost
In decentralized trading, users may face liquidity-pool fees, gas fees, price impact, and slippage settings at the same time.
A liquidity pool does not gain unlimited capital simply because the interface looks clean. A swap changes the ratio between assets in the pool. The larger the trade relative to available liquidity, the greater the likely price impact.
Slippage tolerance is also widely misunderstood. It is not an additional fee charged by the platform. It is the maximum deviation from the quoted result that the user is willing to accept.
Set it too low, and a small market movement may cause the transaction to fail. Set it too high, and execution becomes easier, but the user may accept a much worse result and create more room for harmful transaction ordering.
A failed on-chain trade does not necessarily mean that no computation occurred. Ethereum transactions pay gas for the computation performed by validators. A failed swap may therefore produce no tokens while still consuming a network fee.
Ethereum’s transaction documentation explains that gas represents the computational work required to process a transaction.
Large DEX trades submitted through a public mempool may also be exposed to MEV. Searchers can observe pending transactions and arrange their own trades before and after a target transaction to extract value from the resulting price movement. Ethereum’s MEV documentation notes that sandwich trading can create higher slippage and worse execution for users.
Perpetual futures introduce another layer of complexity.
In addition to opening and closing fees, traders must account for funding rates. Funding generally helps keep perpetual contract prices aligned with spot prices. Unlike a one-time trading fee, funding can recur whenever a position remains open at the relevant settlement time.
For example, a trader may use 1,000 USDT of margin to open a 10,000 USDT position. At a 0.01% funding rate, one payment appears to cost only 1 USDT. But if the position is held for a long time, funding rises, or the market remains crowded, accumulated funding can steadily erode the position’s profit.
Leverage also creates a psychological mismatch. The trader focuses on the amount of margin deposited, while many costs are calculated from the much larger notional position.
You may feel that you used only 1,000 USDT, while the market calculates costs and risk using a 10,000 USDT exposure. This is where traders begin asking the classic question: “The fee did not look high, so why did my account equity fall so quickly?”
When a position approaches liquidation, implicit costs can expand further. Liquidations often occur during rapid price movement and stressed liquidity. The system must prioritize risk reduction rather than wait for an ideal price. The resulting loss may include not only a liquidation-related charge, but also execution at an unfavorable time in a thin market.
How Much Can a “Cheap” Trade Really Cost?
Suppose Alice wants to spend 10,000 USDT on a newly listed token.
The latest displayed price is 1 USDT and the trading fee is 0.1%. Alice quickly estimates a cost of about 10 USDT and submits a market order.
However, the lowest ask has already moved to 1.005 USDT, and the sell-side depth is weak. Alice’s order consumes several price levels, producing an average execution price of 1.02 USDT.
At the 1 USDT benchmark, she expected to receive 10,000 tokens. After price impact and fees, the actual amount is already below 9,800 tokens.
A few days later, the chart still shows a price near 1 USDT. Alice assumes she has barely lost anything and decides to sell. But the bid side is also thin, and her average exit price is only 0.985 USDT.
At this point, her cost is not merely two 0.1% trading fees. It includes:
- The spread paid when entering;
- Price impact created by the size of the order;
- Trading fees on both entry and exit;
- Additional slippage on exit;
- The opportunity cost of capital remaining tied up during the holding period.
The token’s displayed price barely changed, yet Alice may still lose several hundred USDT. The directional view was not obviously wrong, but the trade still lost money. Market direction determines only part of the outcome. Execution quality determines how much of that outcome actually reaches the account.
A more complete approach is to estimate all-in cost before trading: spread, order-book depth, expected average execution price, trading fees, on-chain fees, funding rates, and the liquidity likely to be available when exiting.
Small test orders, staged execution, limit orders, and time-weighted execution may reduce price impact. But none is a free lunch. Staging increases the number of transactions, limit orders may not fill, and waiting may cause the market to move away.
Cost management is not about finding a trade with no cost. It is about choosing more intelligently among different forms of cost.
SuperEx Example: Reducing Cost Begins with Making It Visible
Using SuperEx as an example, its spot order book, market and limit execution methods, and additional liquidity supplied through the Free Market AMM form an important part of the execution environment.
The Free Market AMM can reflect pooled liquidity in order-book depth, helping the market form more continuous quotations. For traders, stronger depth and tighter bids and asks can reduce the price impact created by ordinary orders.
That does not mean every order size can execute with zero slippage. No liquidity mechanism can eliminate supply and demand. The larger the order, the faster the market, and the less active the pair, the more important it becomes to inspect real-time depth rather than stare only at the last price.
SuperEx uses funding rates to help align perpetual prices with spot markets. Funding is exchanged between long and short users rather than collected by the platform. Settlement intervals and rates may differ across trading pairs, and relevant parameters may be adjusted during extreme volatility. SuperEx Funding Fee Rules
What SuperEx can do is improve the trading environment and rule transparency through its order book, AMM liquidity, index pricing, funding mechanism, and risk controls. It cannot remove market volatility on behalf of traders, but it can help users better understand the market they are entering.
A mature trading platform should not merely display fee rates clearly. It should also help users understand depth, execution, leverage, and risk. Price transparency is only the first step. Execution transparency determines whether the trade is truly expensive.
Conclusion
The cost paid by a trader has never been limited to the published fee.
In centralized order books, cost may be embedded in spreads, depth, and average execution prices. On DEXs, it may appear through gas, price impact, slippage settings, and MEV. In perpetual futures, it may also arise from funding, leverage-amplified notional exposure, and unfavorable liquidation execution.
Fees are the numbers printed at the checkout. Spreads and slippage are the bill the market adds after you turn away.
So, to determine whether a trade is truly cheap, do not stop at “What is the fee rate?” Ask:
- What average price will I actually receive?
- How large an order can this market absorb?
- How much would I receive if I exited now?
- What recurring costs may accumulate while the position remains open?
Only when these questions are considered together does the true price of a trade become visible.
A market does not become charitable because the fee screen shows zero. The cost may simply have moved somewhere else.
About SuperEx
As the world’s first Web3-powered cryptocurrency exchange, SuperEx remains committed to building the Web3 ecosystem through products and services including SuperEx DAO, SuperEx Web3 Wallet, Super Start, SuperEx P2P, SuperEx Stock Markets, SuperEx Copy Trading, SuperEx Earn, and SuperEx DAO Academy.
Today, SuperEx serves more than 10 million users across 166 countries and regions and supports spot and futures trading for over 1,000 crypto assets.
Visit SuperEx DAO Academy Space



Responses