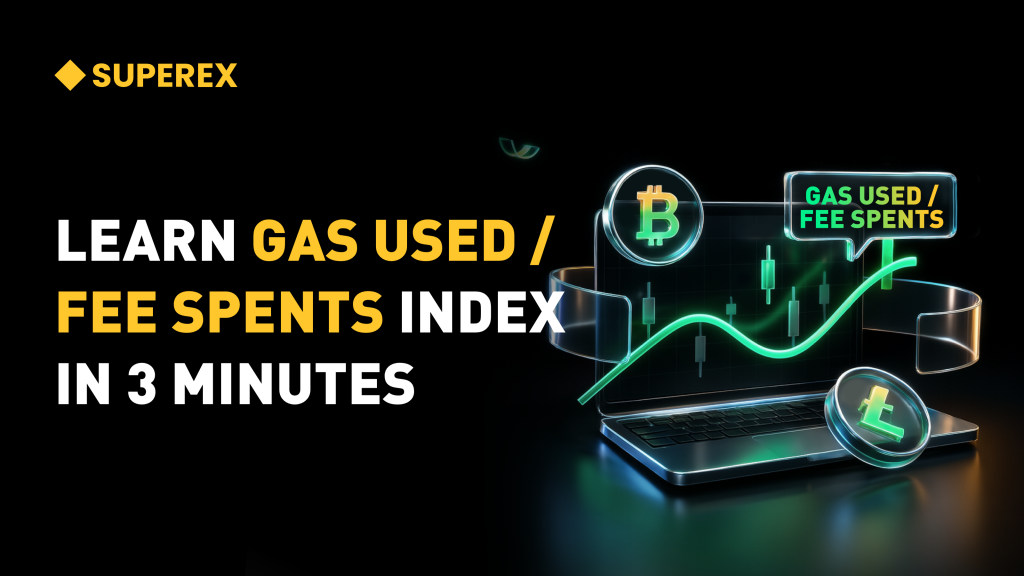
LEARN GAS USED / FEE SPENT INDEX IN 3 MINUTES ——BLOCKCHAIN 101

Introduction
The Gas Used / Fee Spent Index is a magnifying glass into the true on-chain activity of Ethereum and other networks. It reflects reality more than price charts, and offers more nuance than TVL.

Many times, price fluctuations don’t truly represent how active a network is—don’t forget, market cap management can skew perceptions.If you want to know how hot a chain really is—whether the activity is genuine or just noise—the Gas Used / Fee Spent metric is your best friend.

Put simply, it helps you see what’s really happening on-chain—and whether the money spent is actually worth it.Take 3 minutes to understand it, and become a smarter crypto user.

What Is the Gas Used / Fee Spent Index?

In simple terms, this metric measures how “busy” a blockchain network really is:

  • GAS USED: The actual amount of gas consumed by all operations on the chain (like transfers, smart contract calls, etc.)

  • FEE SPENT: The total money users paid for those operations (denominated in ETH or other native tokens)

When we combine them—Gas Used / Fee Spent—we get something very interesting:How much real on-chain activity is driven by each dollar spent?

Why Is This Metric Important?

We all know: a high TVL means nothing if no one is using the chain—it’s just stagnant capital.But Gas Used / Fee Spent tells you whether a chain is truly active—whether it’s moving efficiently and being used for real things.

Example:
A chain with high gas usage but low fees likely means it’s efficient, cheap, and suitable for large-scale applications.On the other hand, a chain with high fees but low gas usage may be congested, overpriced, or simply dominated by arbitrage bots battling it out.In that case, this metric reveals that the chain might be losing its usability advantage.

How to Interpret This Metric?

1. Index Rising: The network is “busy and efficient”

If you see the Gas Used / Fee Spent ratio rising on a Layer 2 (like Base or ZkSync), it often means:

  • More genuine user activity (swaps, mints, deployments)

  • Lower packaging costs (due to optimizations like compression or batching)

  • Frequent DApp deployments (developer activity is high)

That’s usually a bullish signal.

2. Index Falling: Could suggest high fees + low activity

If the ratio starts dropping, you need to ask:

  • Are fees rising too fast, causing user drop-off?

  • Are bots monopolizing block space and crowding out real users?

  • Has the chain hit an infrastructure bottleneck—e.g., settlement layer or DA layer lagging?

When Is This Metric Especially Useful?

✅ 1. Tracking Layer 2 growth: Compare networks like Optimism, Arbitrum, Scroll, Base, etc.Which one is truly cheap and efficient—not just making marketing claims?

✅ 2. Differentiating real vs fake activity:Some chains fake interactions and transactions. TVL won’t reveal that, but Gas Used / Fee Spent usually exposes the abnormal costs behind the “fake buzz.”

✅ 3. DApp deployment strategy:Planning to launch a new DApp? Use this index to find the chains that are both cheap and truly active—lower costs + user traffic = better growth potential.

Final Words: This Metric Belongs in Your DYOR Toolbox

Gas Used / Fee Spent Index is a subtle but highly practical metric.It’s not as emotional as a price chart, and not as inflated as TVL can be.

It tells you whether a chain is really worth using—whether your money is powering real on-chain utility—and whether your contract can be executed efficiently.

Related Articles

Responses