XRP déjà vu: Is another 60,000% price surge on the horizon?
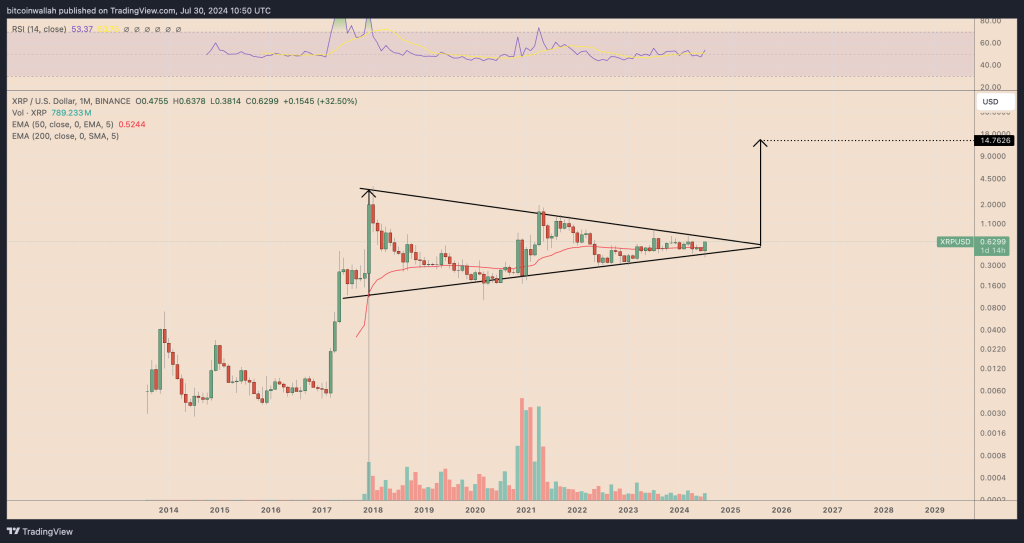
XRP’s monthly volatility has plunged to its lowest levels ever, approaching the range that preceded the 60,000% price surge in 2017-2018.

The XRP (XRP) market is showing patterns that mirror the conditions preceding its monumental 60,000% price rally in 2018.
XRP’s monthly volatility drops to record-low
The Bollinger Band Width (BBW) on XRP’s monthly chart hit a new low in July, reflecting years of the XRP/USD trading pair moving within a narrower trading range.
From a technical perspective, these periods of low volatility can often precede major price movements. In other words, when the bands are narrow, it suggests that a breakout—either upward or downward—may be imminent as the market transitions back to higher volatility.
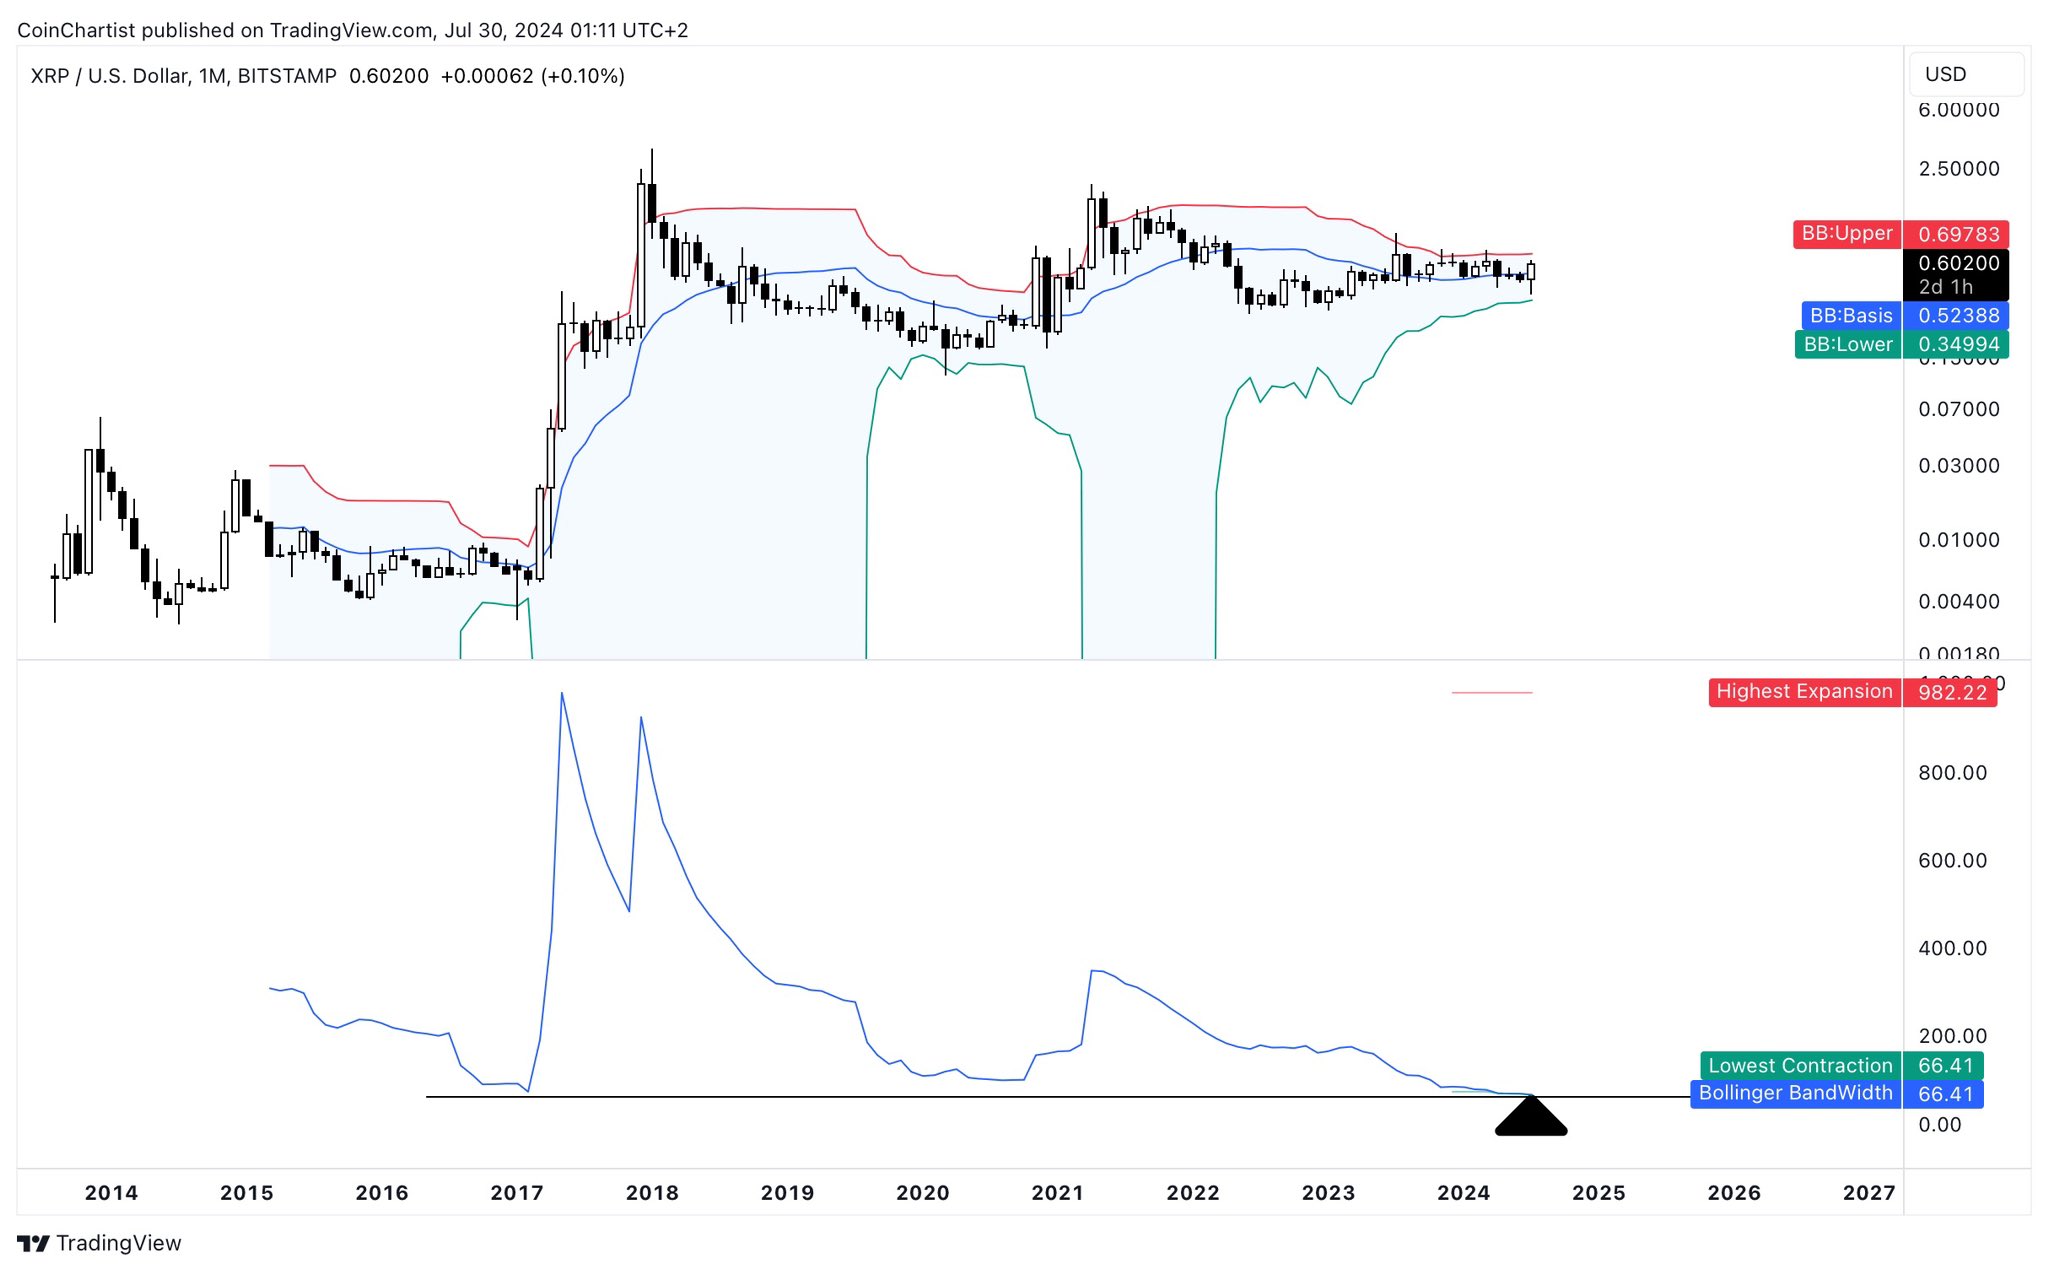
For instance, XRP’s BBW was the narrowest during the 2016-2017 session, accompanying a flatlining price action inside the $0.0050-0.0090 range. That was followed by a 66,000% price breakout, with the XRP monthly volatility, as indicated by the BBW readings, rising from 66.50 to as high as 982.22.
This time, XRP’s consolidation has lasted twice as long as during 2016-2017, while monthly volatility has been even lower. As a result, some analysts, including Tony Severino, anticipate a major price breakout in the XRP market.
Can XRP repeat its 60,000% rally?
On the monthly timeframe, XRP’s current valuation of about $0.62 is close to the middle Bollinger Band. This positioning near the middle band typically reflects balanced market forces, with neither strong bullish nor bearish momentum.
XRP’s monthly relative strength index (RSI) reading of around 53 reflects the same neutral sentiment in the market.
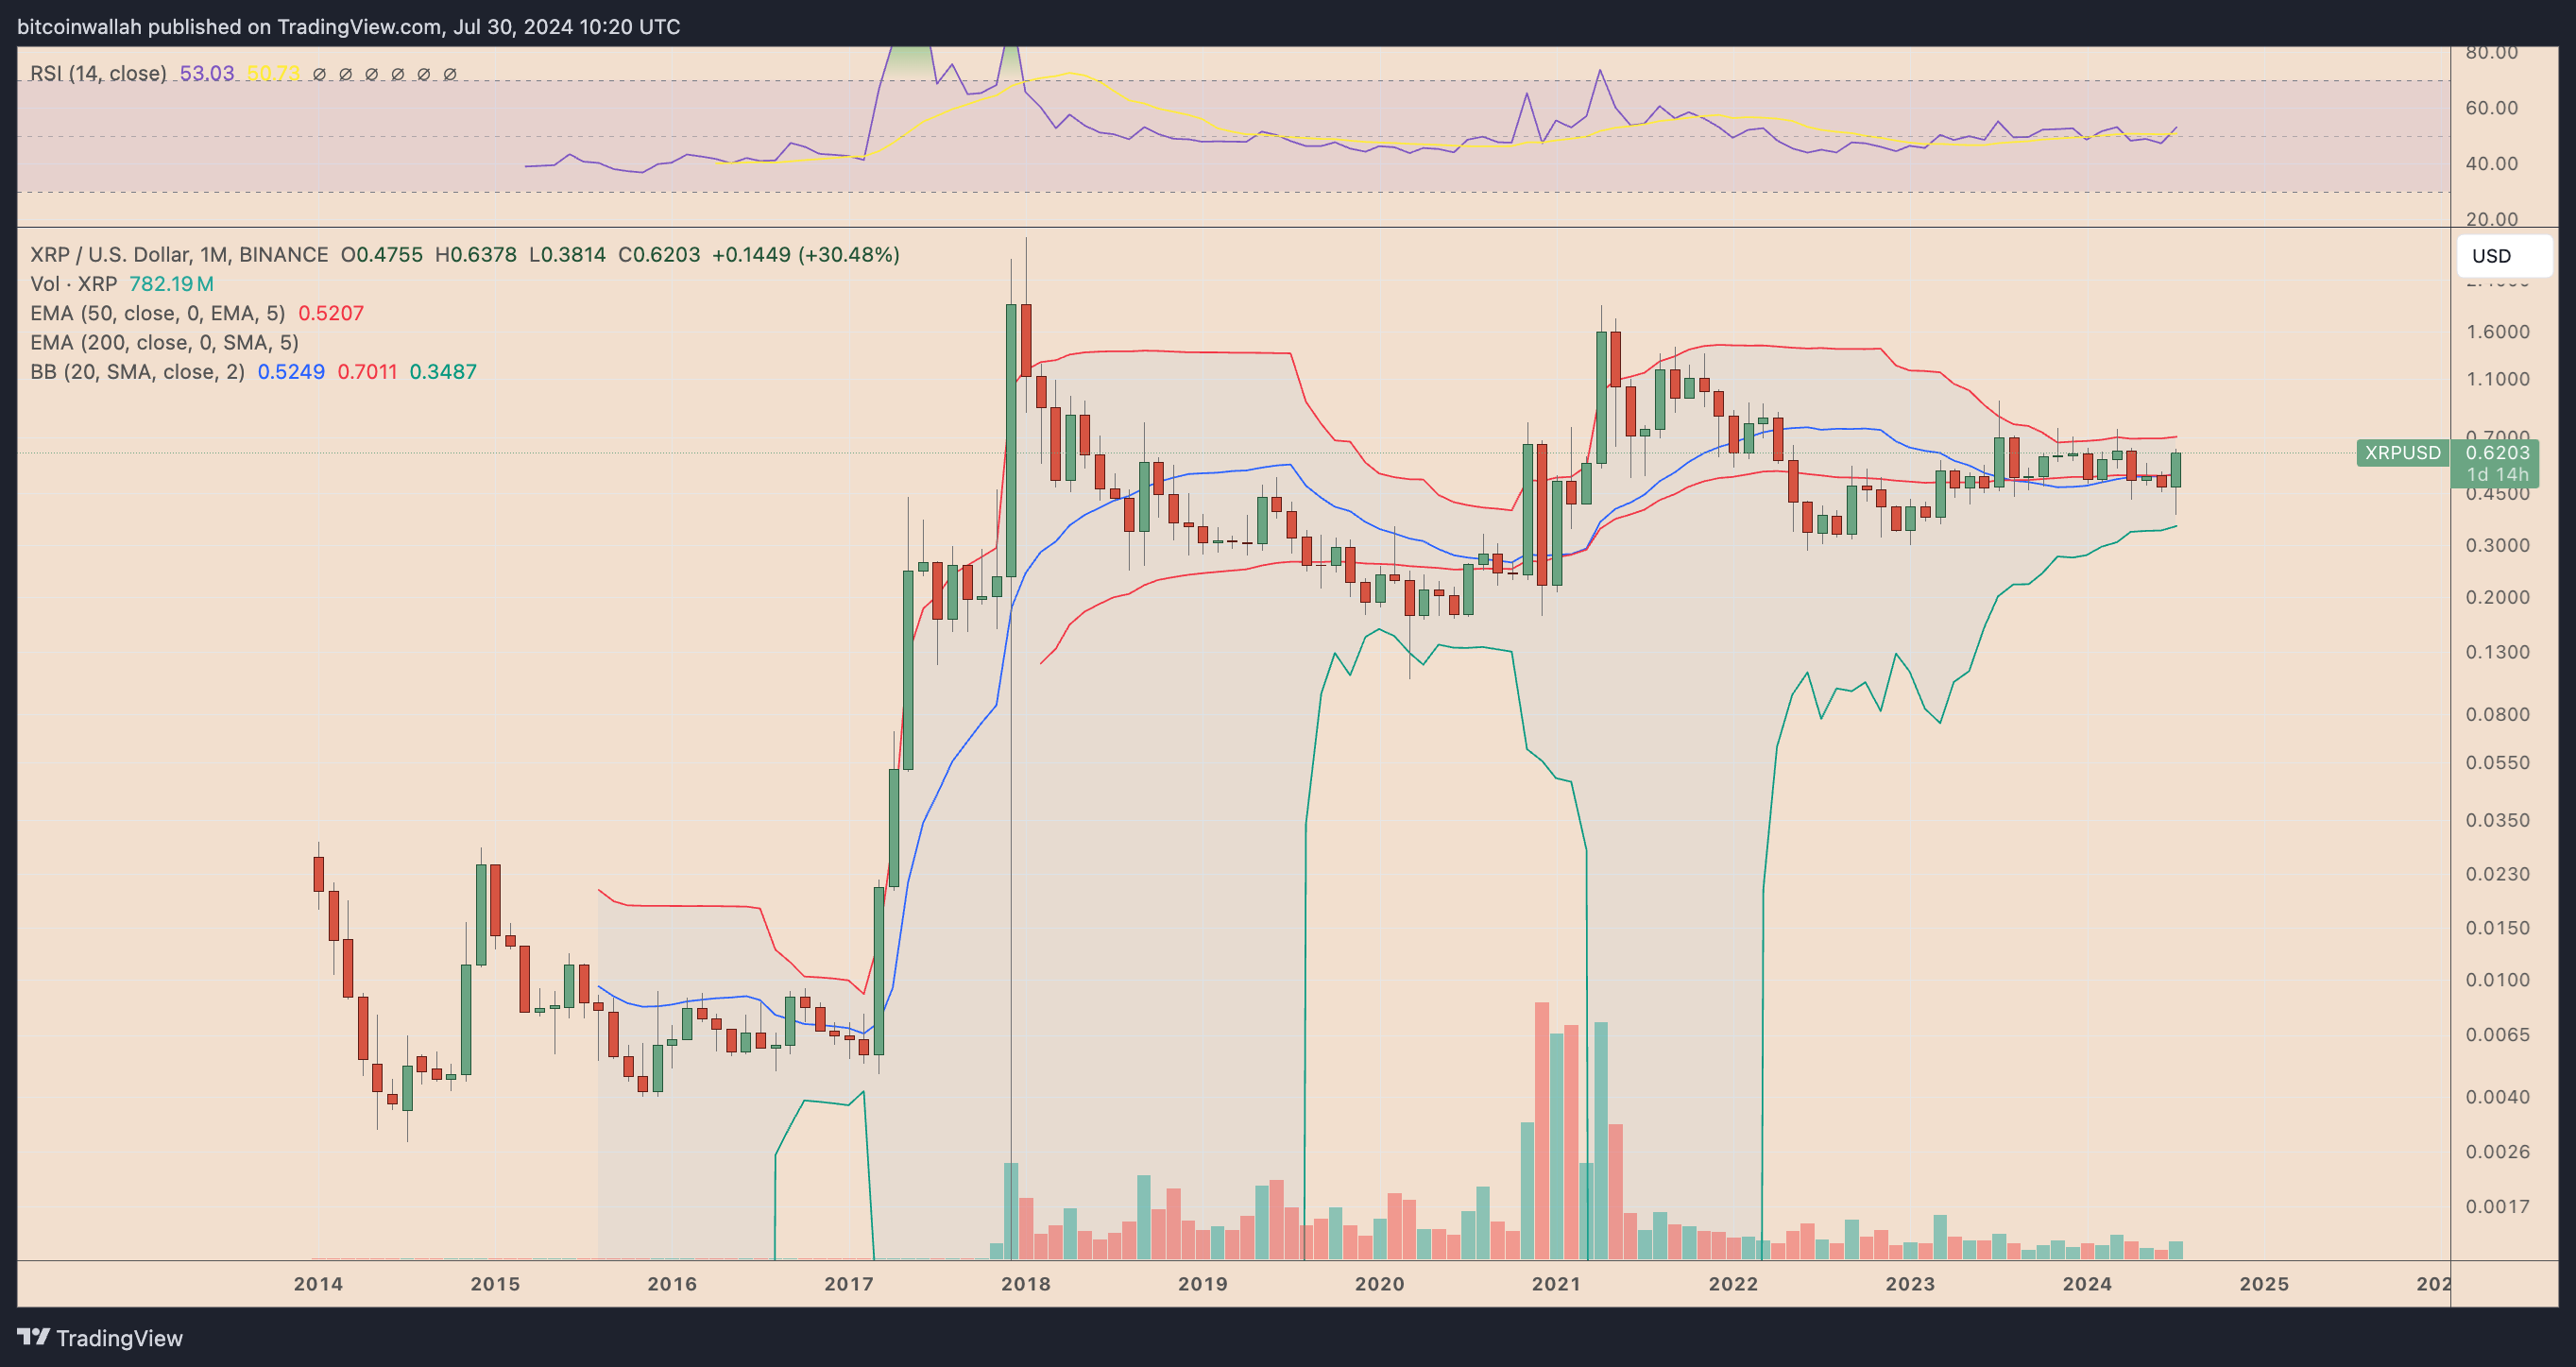
Nonetheless, XRP/USD is trading above the middle Bollinger Band, suggesting that the market is slightly tilted toward the bulls. Coupling it with the similarity in the Bollinger Bandwidth contraction of the 2016-2017 session, the indicator raises the possibility of another substantial price movement.
Interestingly, XRP’s giant symmetrical triangle might be hinting at the same, indicating upside continuation if it forms after a strong price rally.
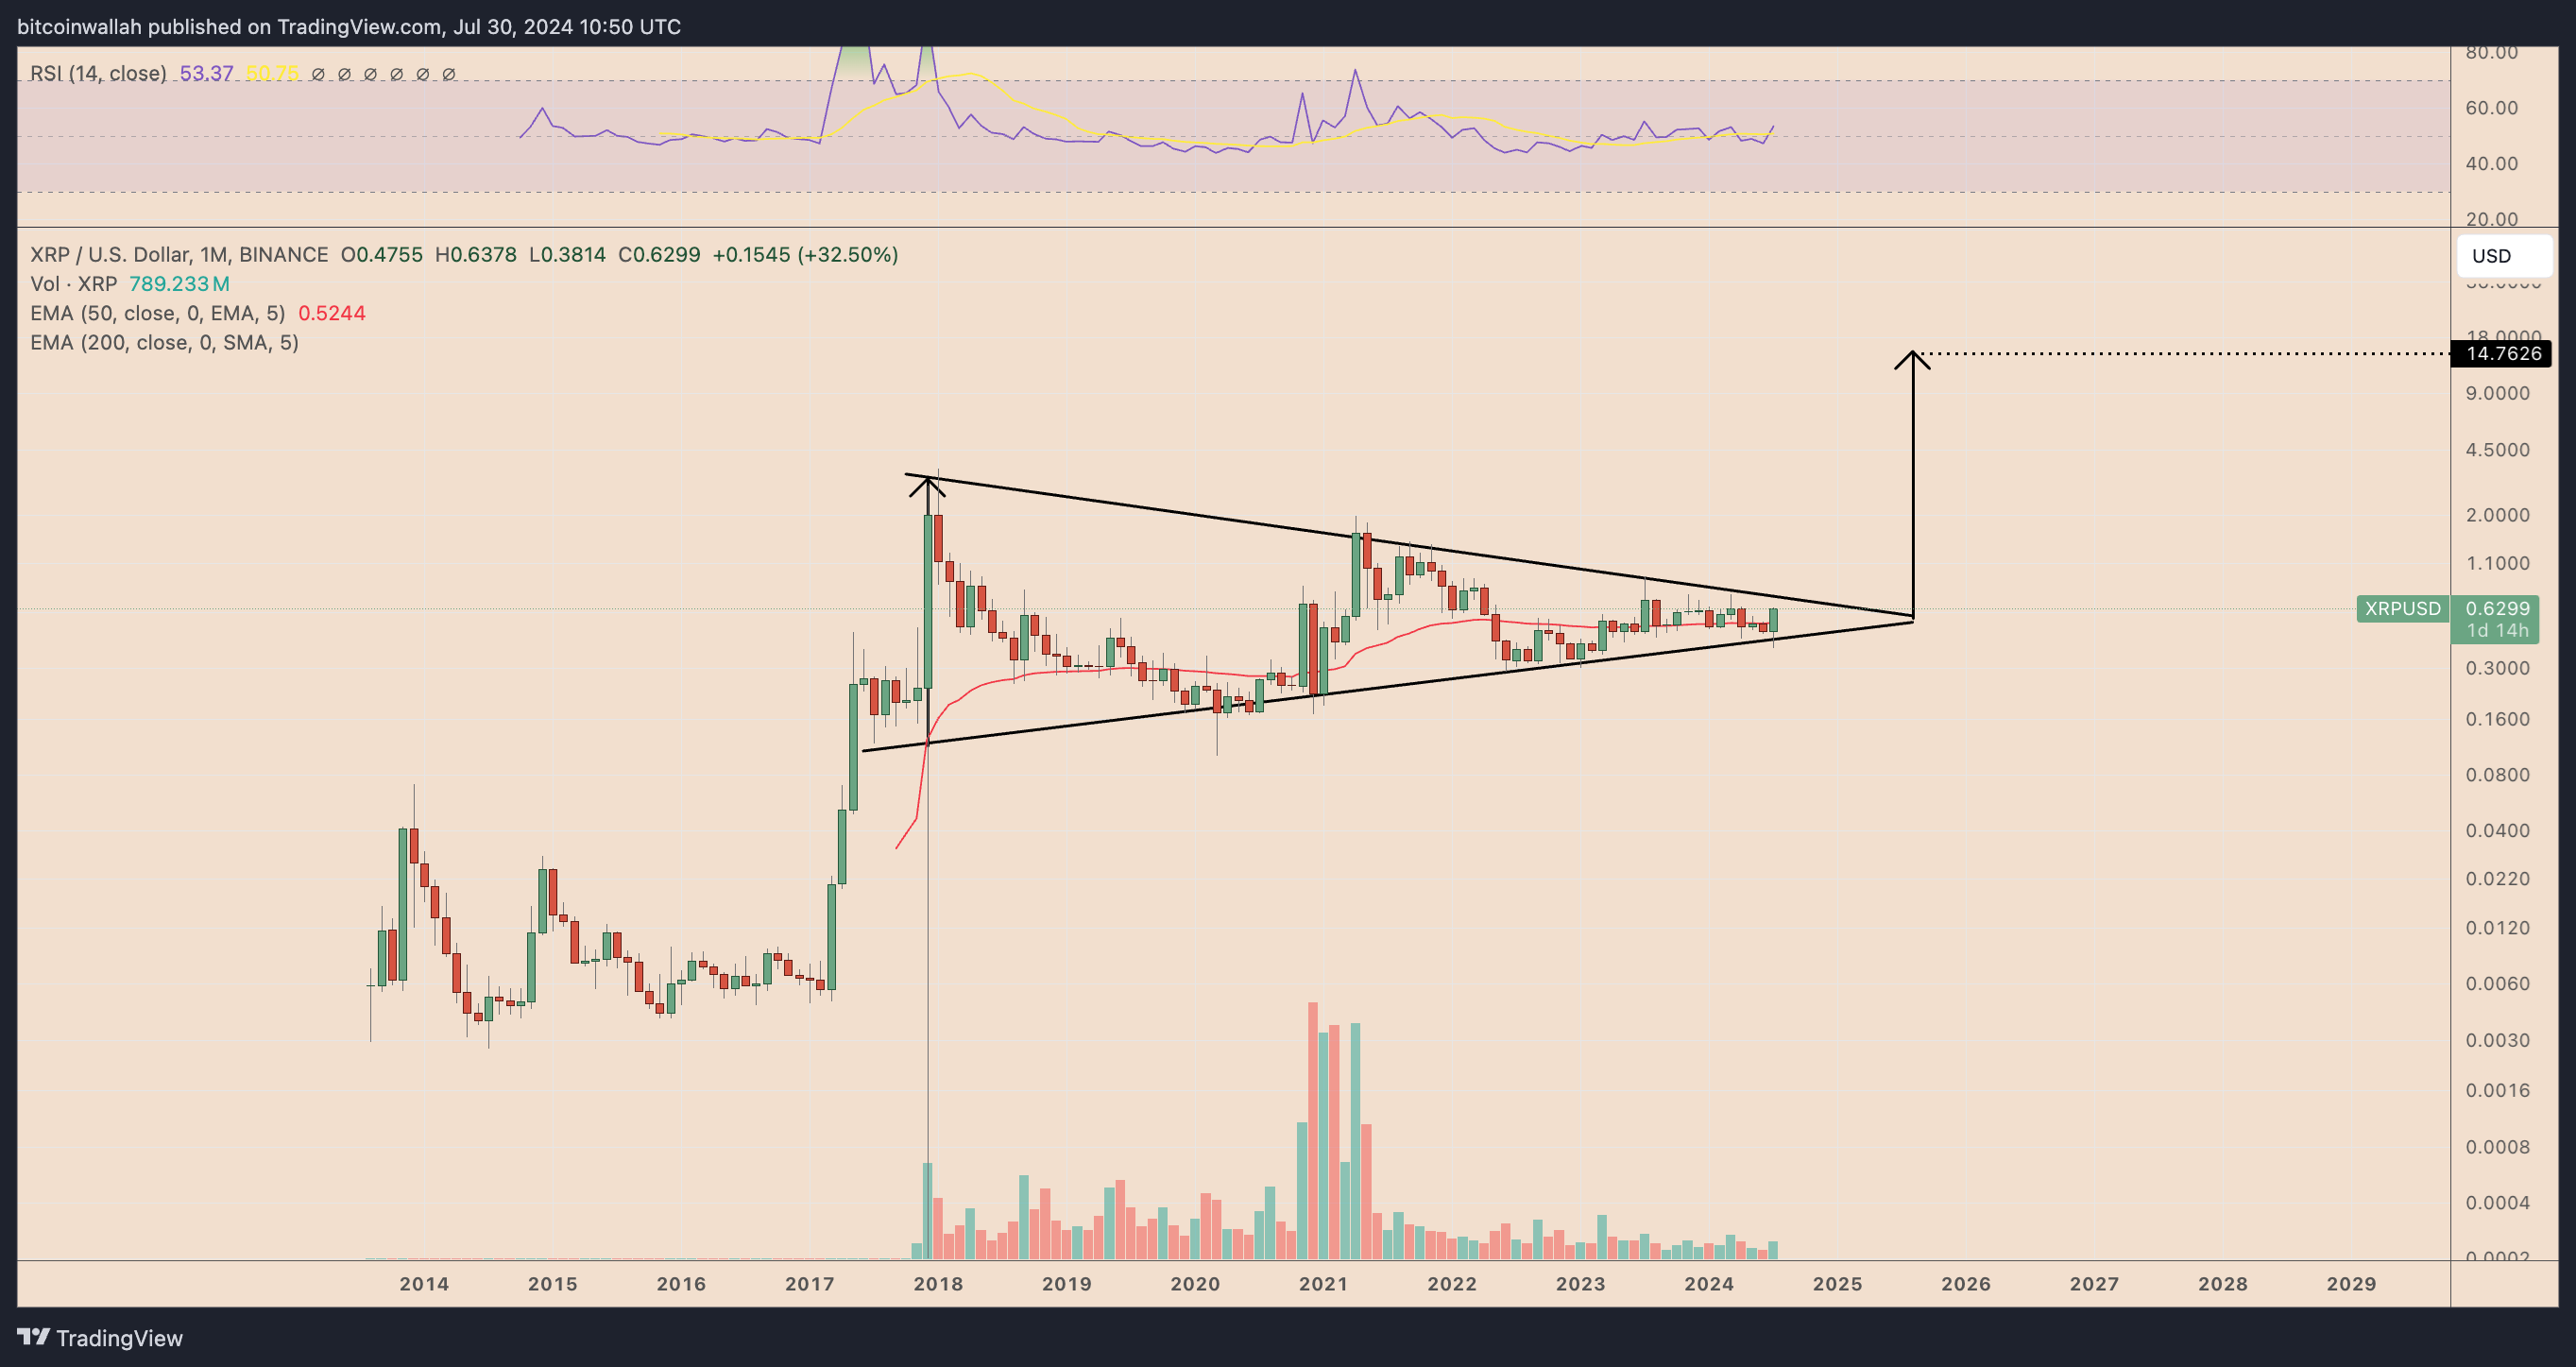
The breakout target of a symmetrical triangle is obtained by measured the maximum distance between its upper and lower trendlines and adding it to the breakout point. Applying the same to XRP’s monthly chart brings its upside target to $14.75, up about 2,200% from the current price levels.
Related: SEC backs down on claiming SOL, ADA, MATIC, other tokens are securities in Binance suit
From a fundamental perspective, the narratives that may accompany XRP’s upside moves include potential crypto-friendly regulations in the United States if Donald Trump is reelected and the conclusion of the SEC vs. Ripple lawsuit.
Nonetheless, an XRP breakout scenario may take months to play out, likely after its triangle’s upper and lower trendlines converge in August 2025. In the meantime, any decisive breakdown below the lower trendline risks invalidating the long-term bullish scenario.
This article does not contain investment advice or recommendations. Every investment and trading move involves risk, and readers should conduct their own research when making a decision.

Responses