Bitcoin traders forecast $80K+ BTC price target after recent funding rate reset
Analysts expect Bitcoin price to test the $80,000 zone now that the halving is complete and BTC’s funding rate reset.

Bitcoin (BTC) marked its highest daily close in over ten days on April 21, reclaiming the $65,000 level. BTC price rose from a low of $64,346 on April 21, climbing 3.5% to an intraday high of $66,527 on April 22.
Data from Cointelegraph Markets Pro and TradingView showed BTC price trading at $65,910 at the time of publication, up 1.7% over the last 24 hours.
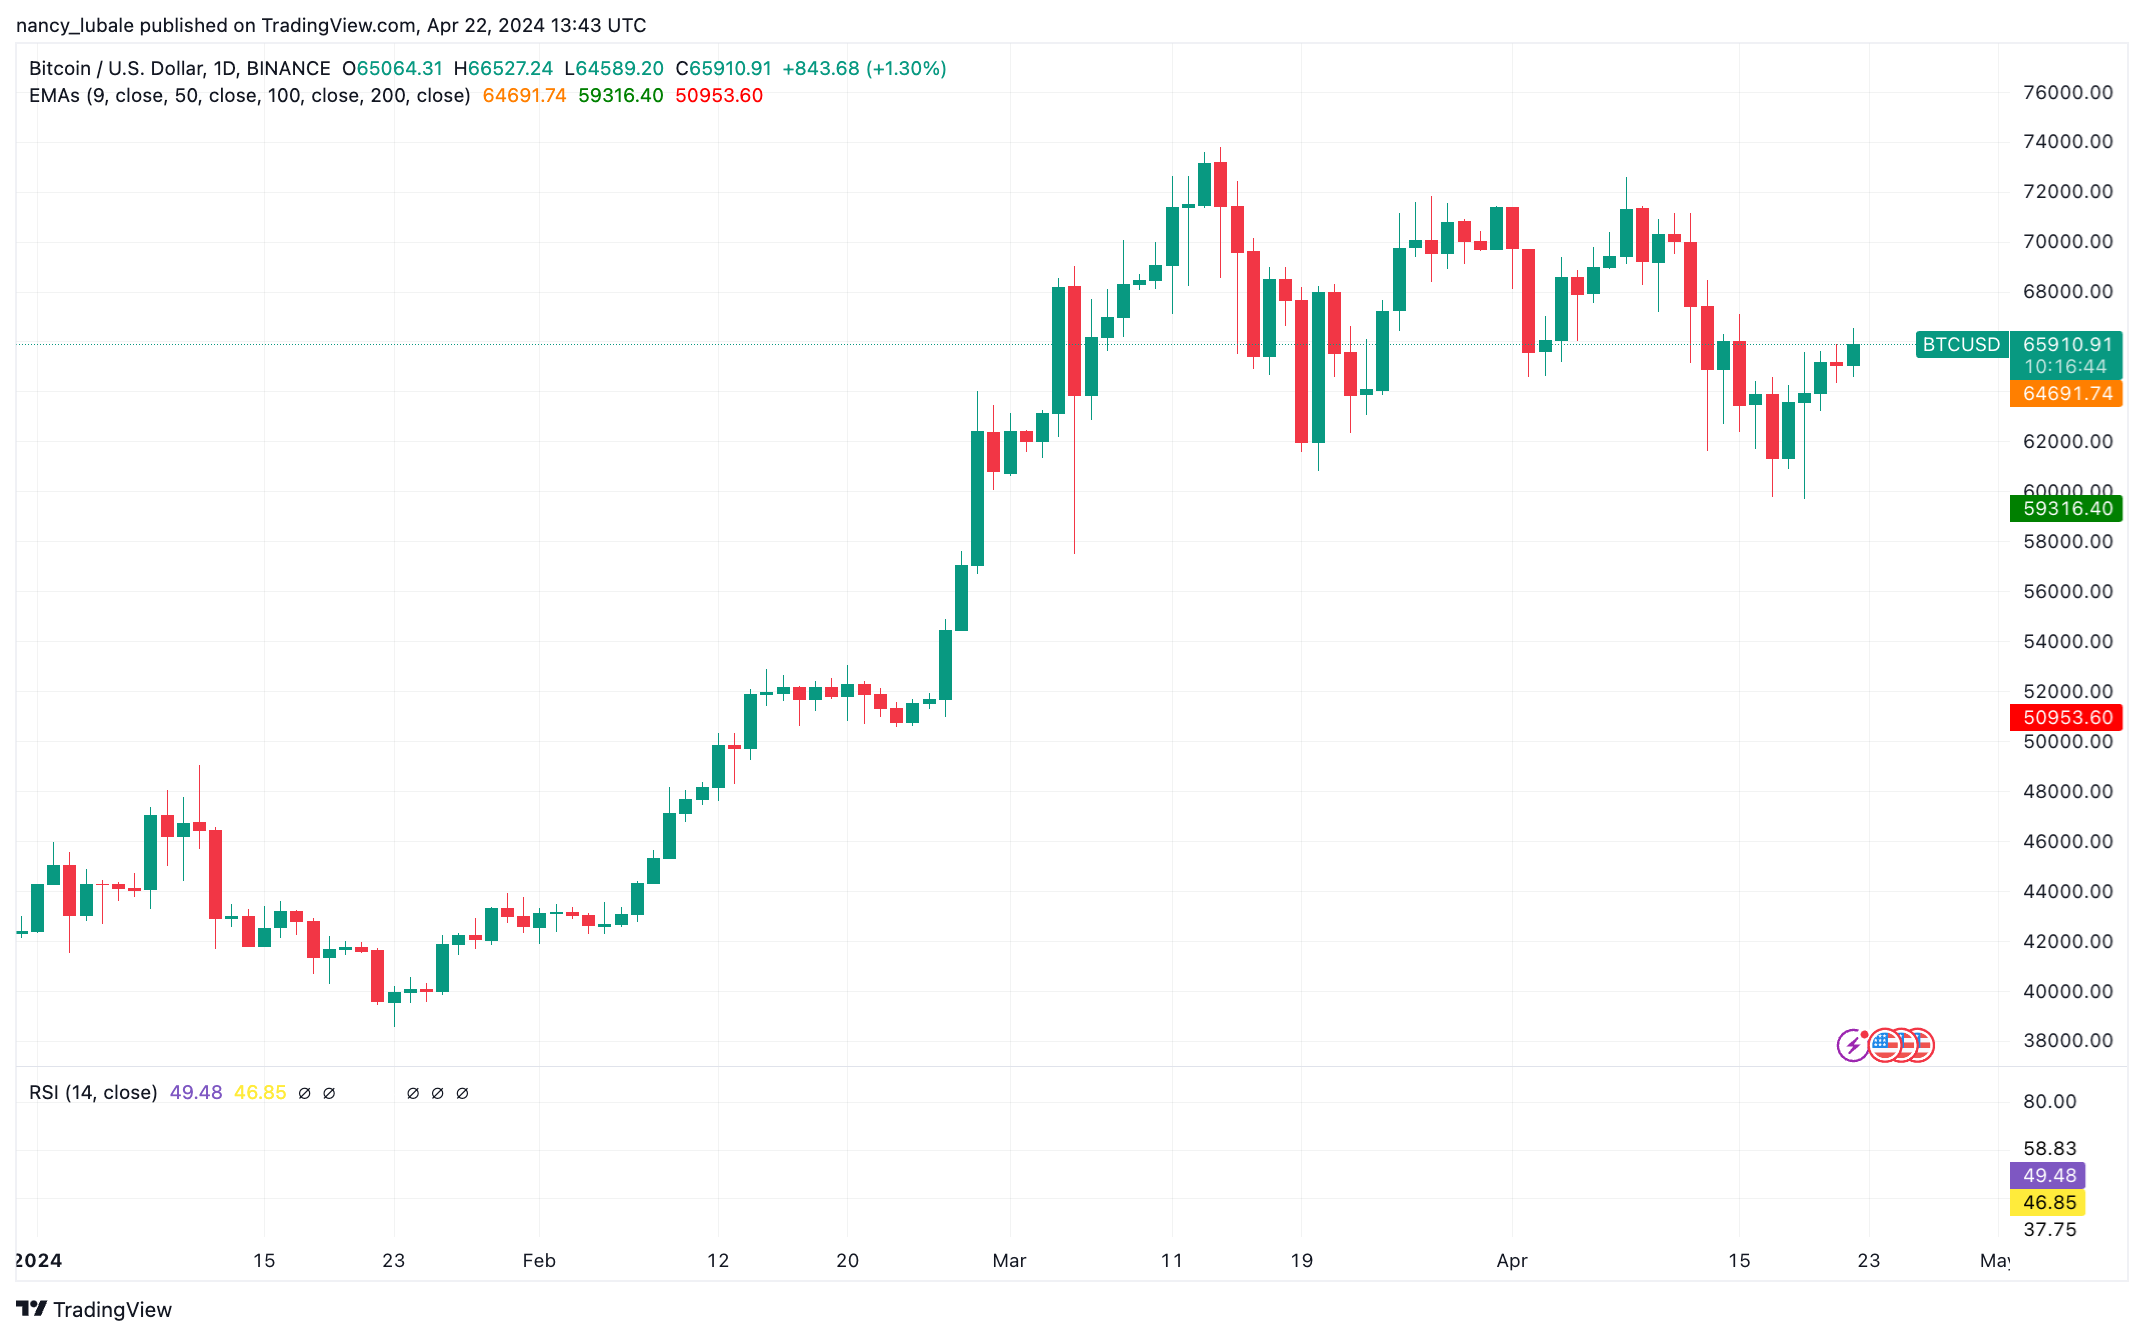
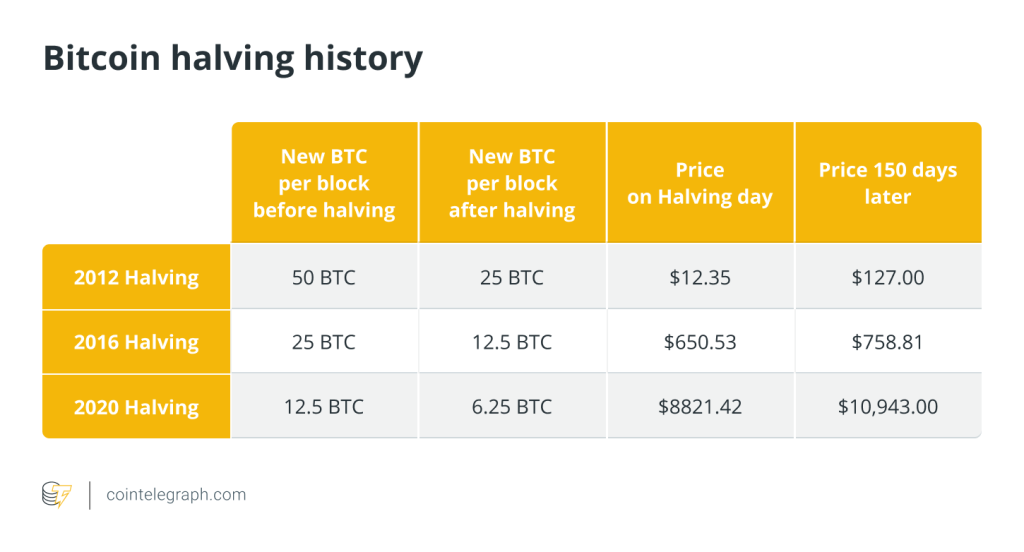
The price of the pioneer cryptocurrency has been up 5% since the Bitcoin supply halving two days ago. This saw miner rewards cut in half, from 6.25 BTC per block to 3.125 BTC. Some market participants are wondering whether Bitcoin will continue its uptrend post-halving.
Let’s look at the factors that could drive BTC up over the coming months.
Bitcoin open interest mirrors October 2023
Data from Coinglass data reveals that Bitcoin’s open interest (OI) funding rate flipped negative on April 18 and again on April 21. The metric is now back in the positive region and resting at 0.0079% on April 22, indicating a rising appetite for long positions.
This shift in market sentiment typically becomes evident after significant price movements, as seen with the 5% ascent in Bitcoin’s price between April 20 and April 22.

The recent drop in Bitcoin OI below 0% marked the lowest levels in over six months, a similar set-up seen in October 2023 as observed by X user Tedtalksmacro.
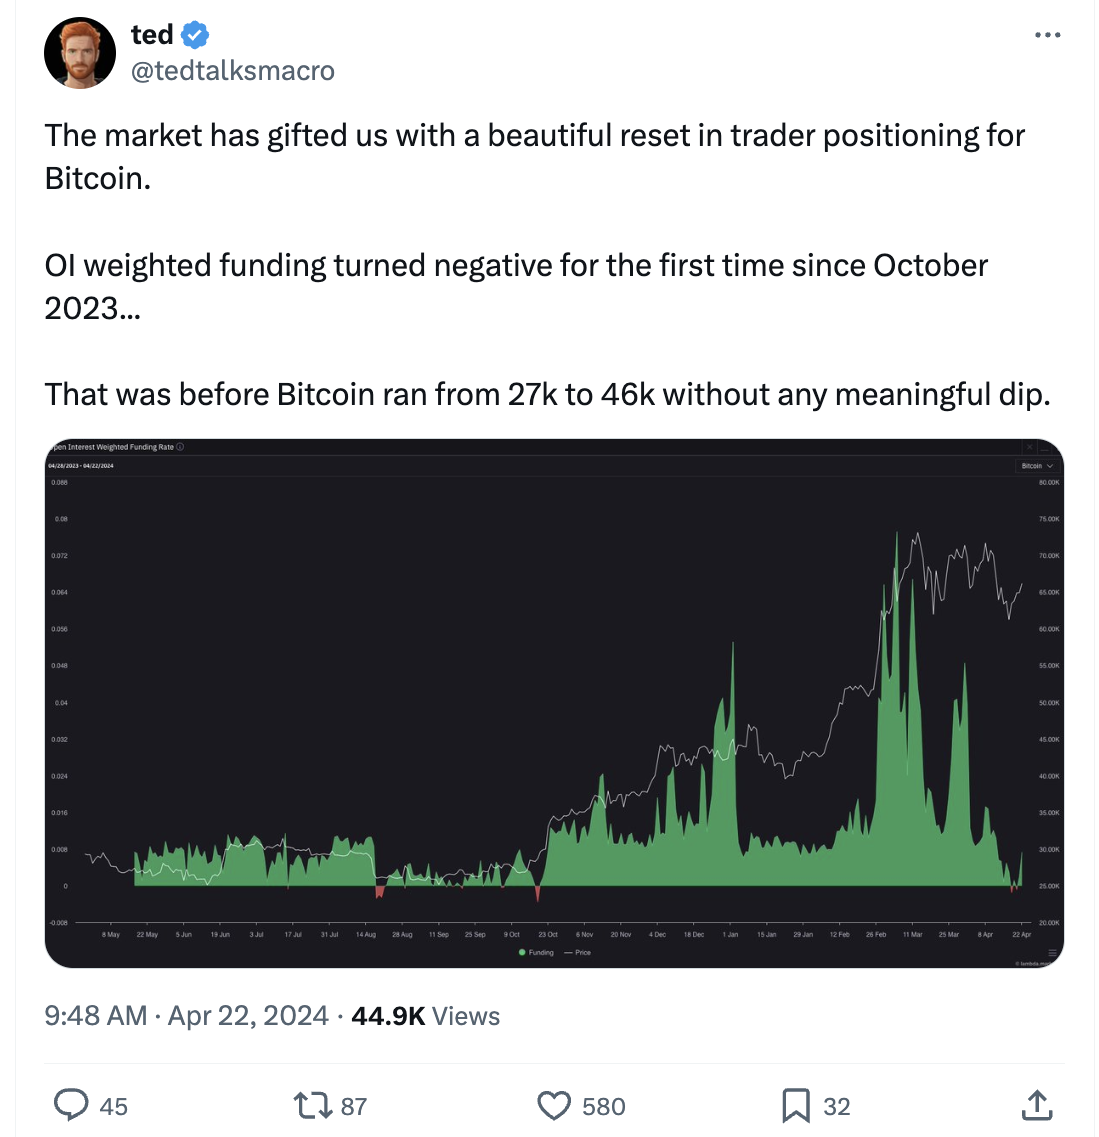
Bitcoin’s price has risen 146% since October, and if a similar scenario plays out, BTC could lead the broader market in a lasting rebound.
Bitcoin price finds strength above $60,000
Last week, Bitcoin’s price action was characterized by selling at each Wall Street open.
Analyzing the current technical setup, independent trader Skew described the weekly close above $65,000 as “pretty good.”
In an earlier tweet, the trader shared the following chart with his X followers, saying that the zone between $65,000 and $66,000 was “sticky” for Bitcoin price.
“The $65K – $66K area has been relatively sticky for HTF trend. 4H trend will lead into higher timeframe confirmations, I think today, so that’s essentially what I am focused on.”

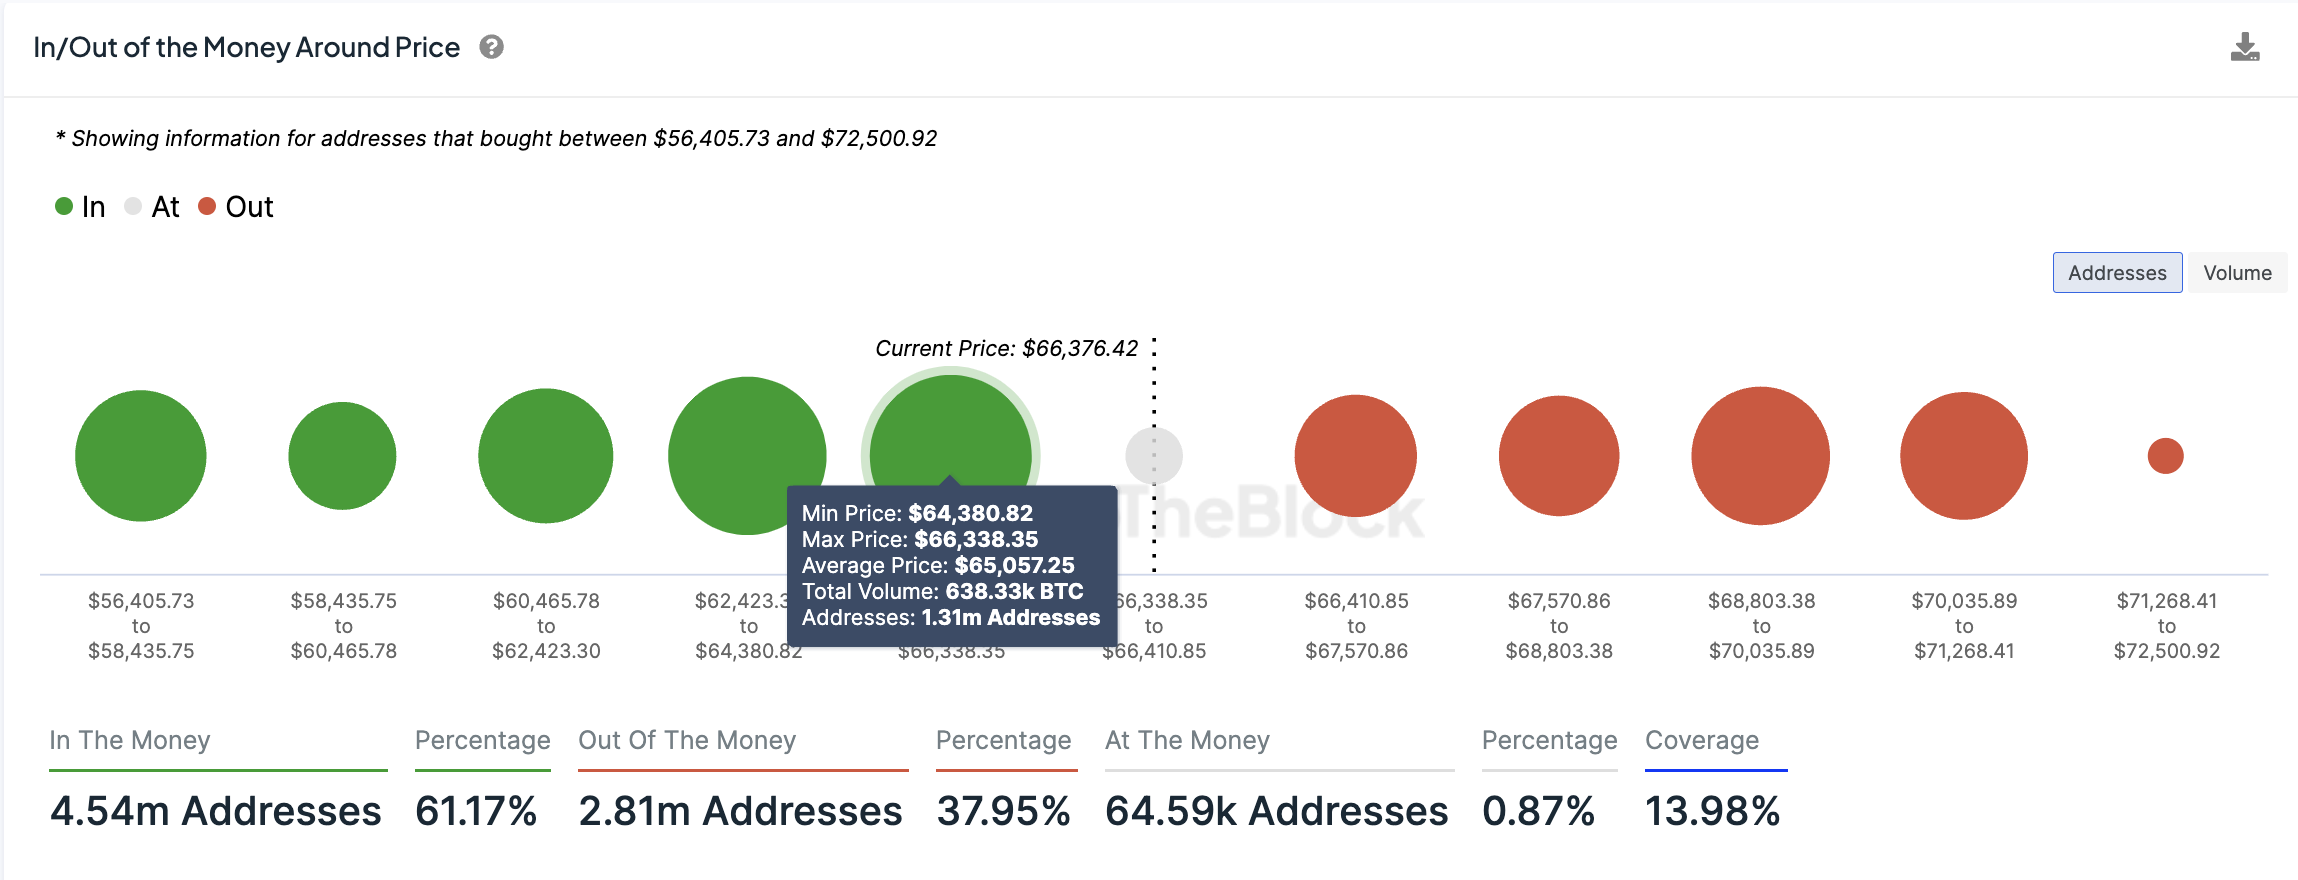
Note that BTC has since climbed above this zone and now sits on relatively strong support defined by this demand area. This is reinforced by data from IntoTheBlock, whose In/Out of the Money Around (IOMAP) model shows that BTC price enjoys strong support on the downside compared to the resistance in its recovery path.
The IOMAP chart below shows that this zone is within the $64,380 to $66,338 price range, where approximately 638,330 BTC were previously bought by 1.31 million addresses.
Continuing, popular crypto analyst Rekt Capital said BTC price has established a strength above the $60,000 mark.
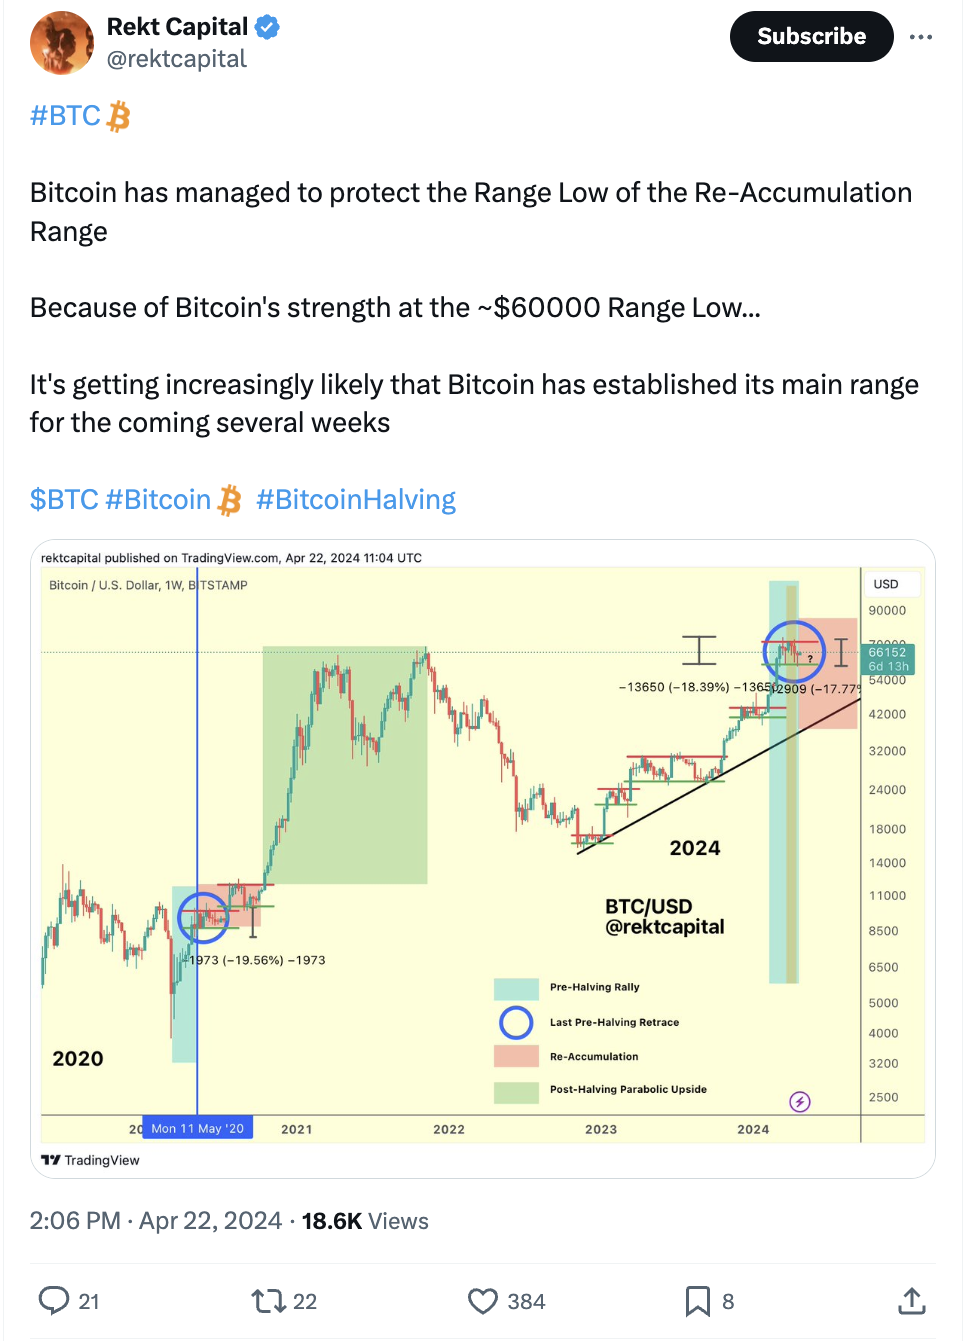
According to the anonymous trader, Bitcoin is likely to accumulate between the $60,000 range low and $70,000 range high for a few months in a “re-accumulation” phase before the price enters a “post-halving parabolic upside.”
Related: The Runes protocol will ignite a new season for Bitcoin after the halving
Traders focus on Bitcoins post-halving upside
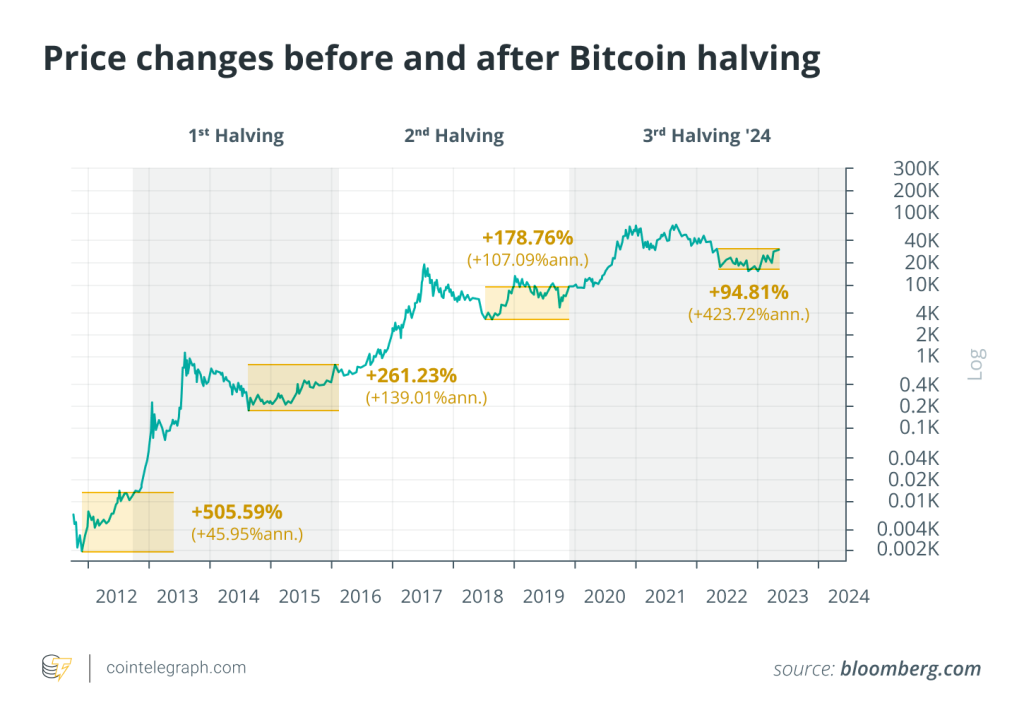
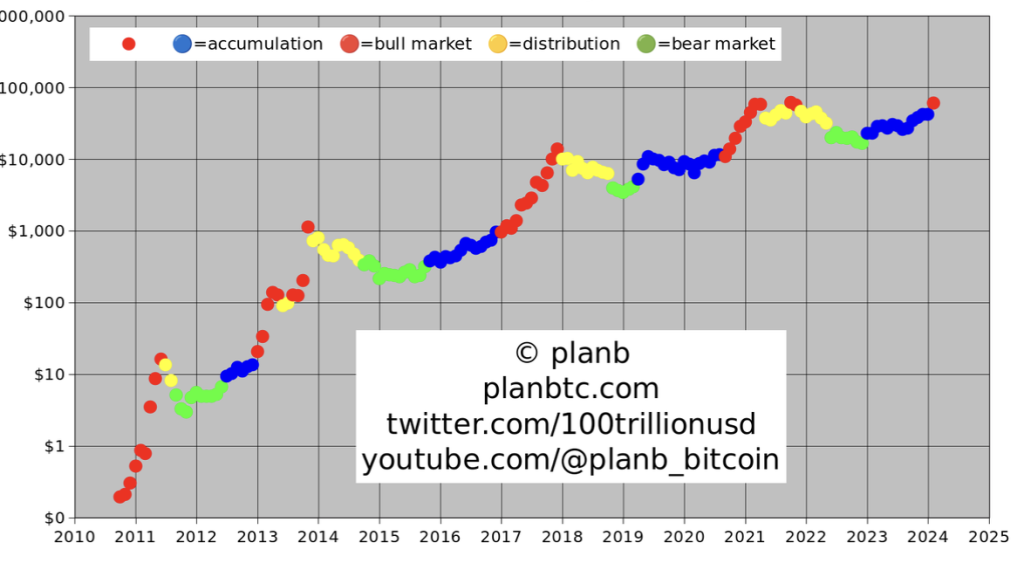
With the Bitcoin fourth halving now complete, market participants are considering how Bitcoin price will react afterward.
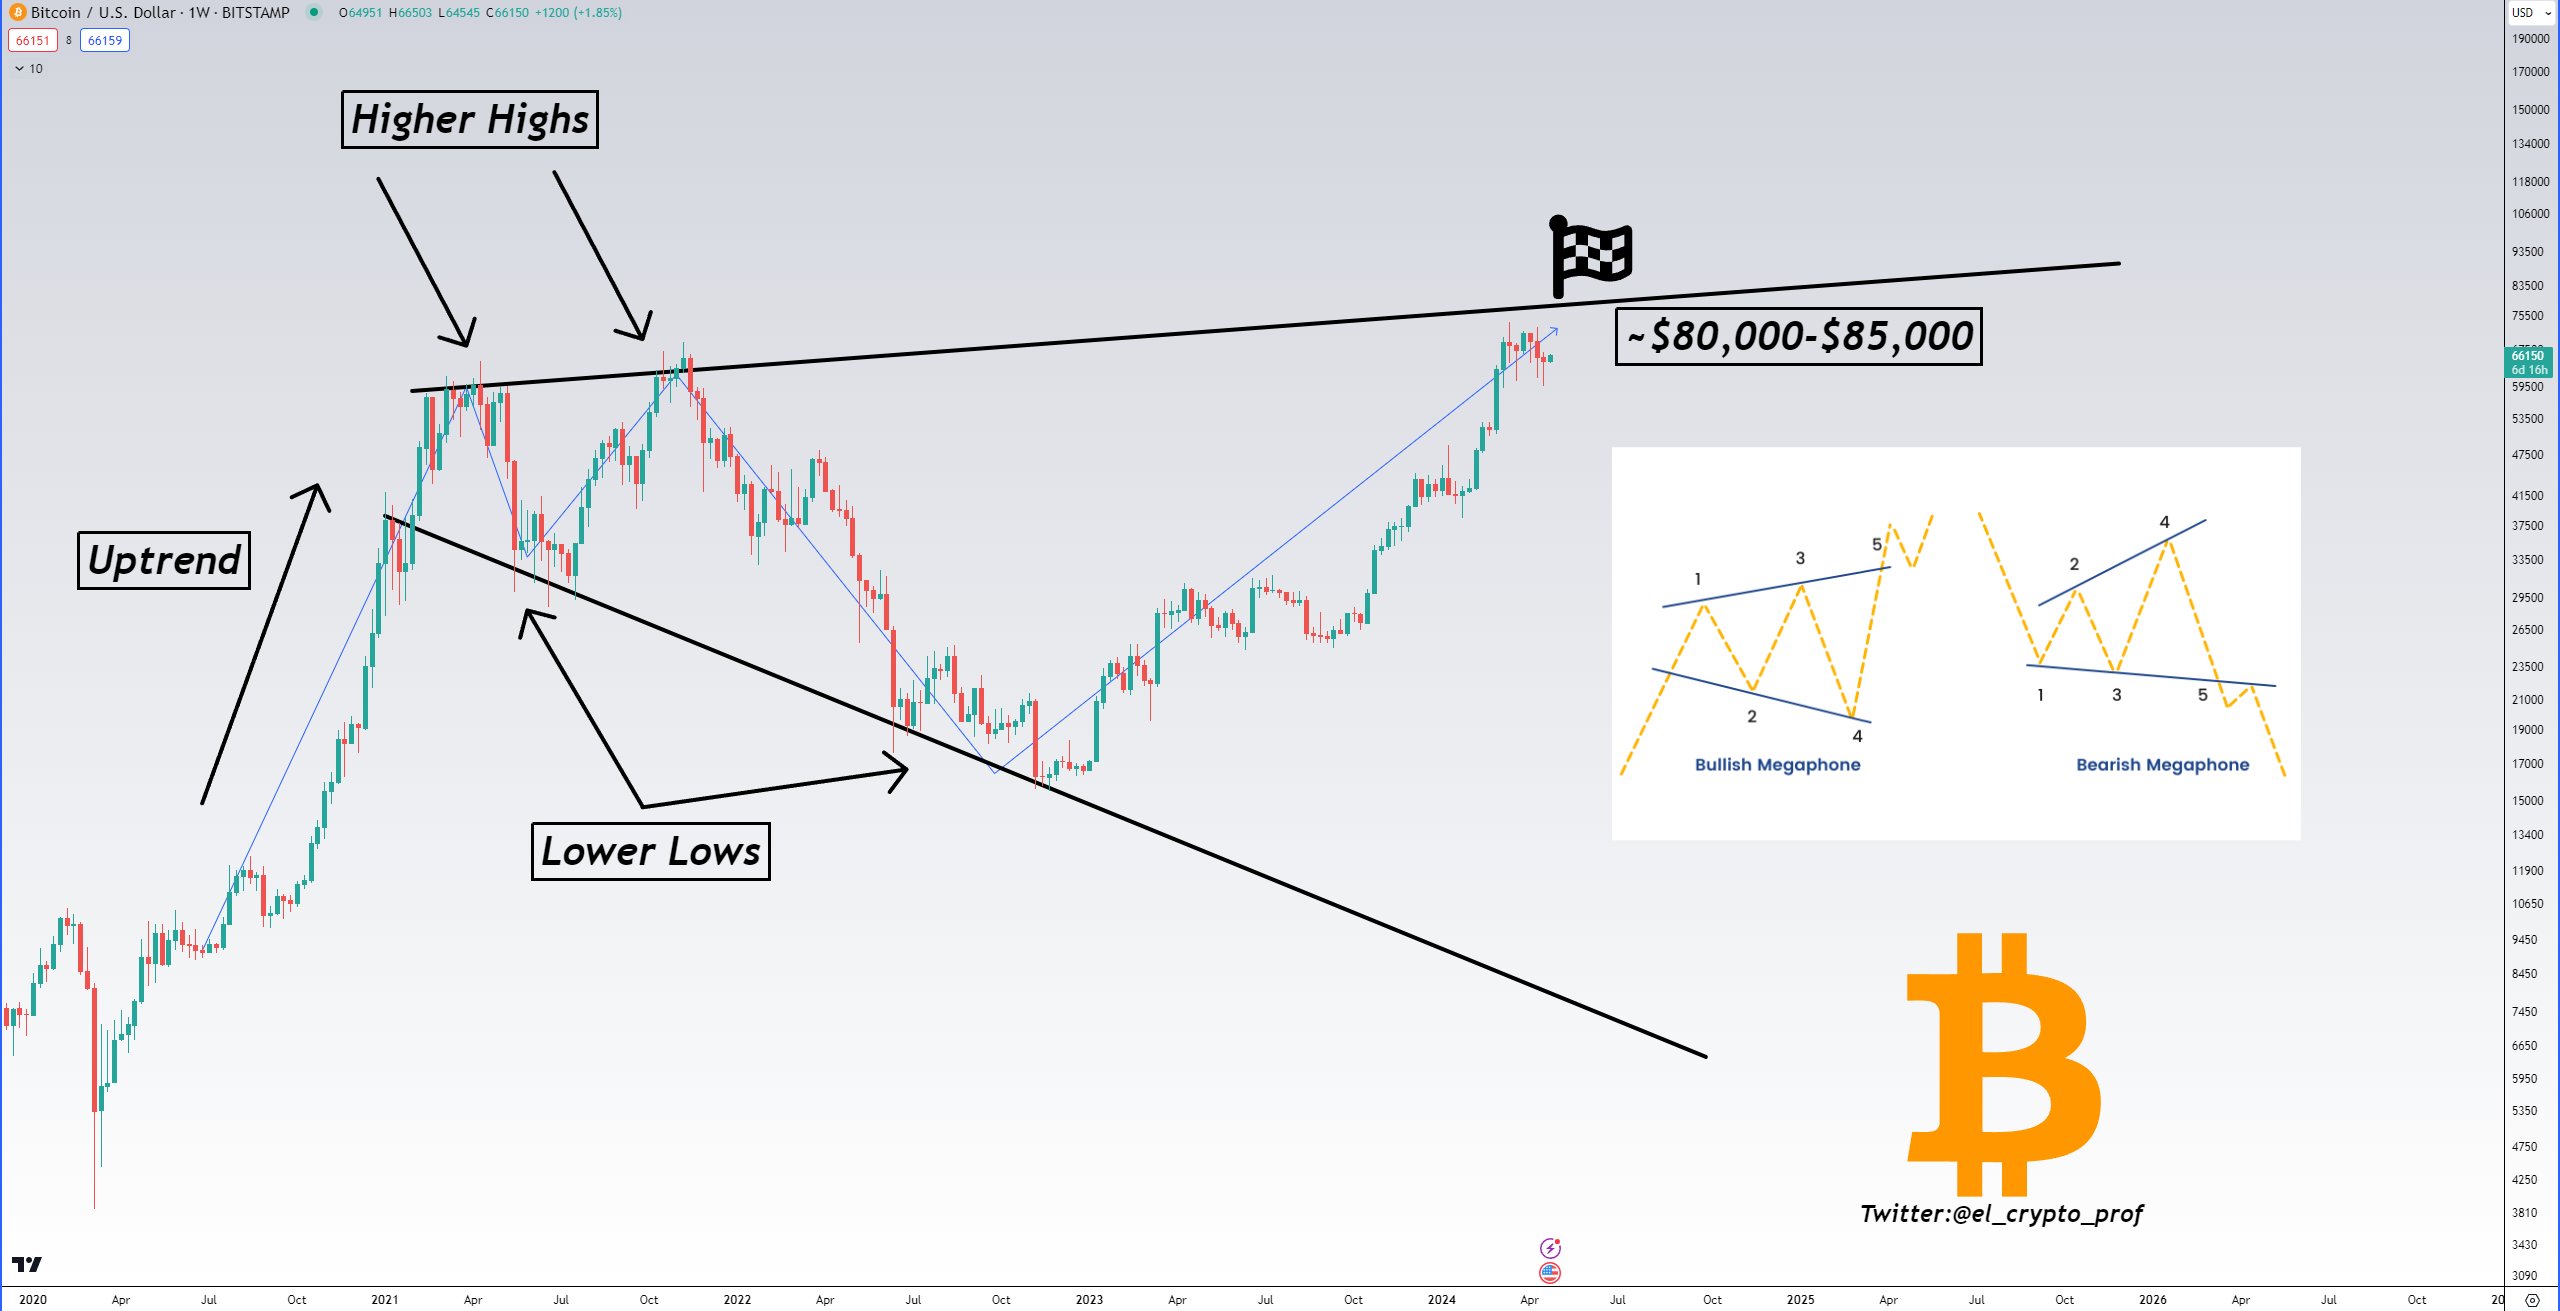
One of them is pseudonymous X user Moustache, who shared a chart tracking Bitcoin’s price action since it reached its previous peak in 2021. According to Moustache, the next important target for BTC price moving forward is the $80,000 mark, a target they have been focusing on since 2022.
“$BTC’s next major target: $80,000-$85,000. Anyone who has been following me for a while knows that I’ve been focussing on this target since 2022.”
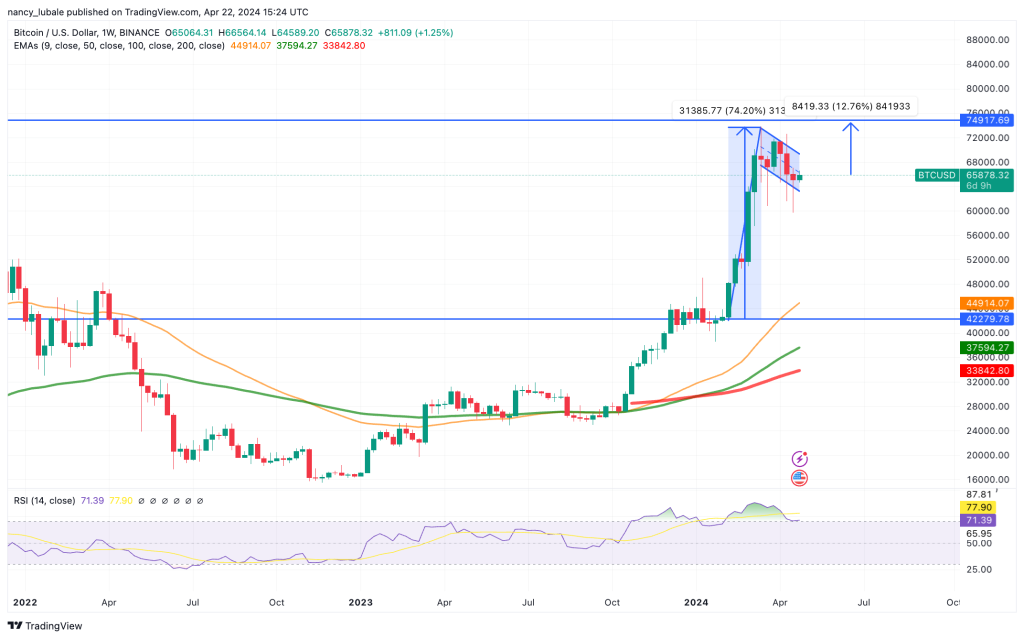
From a technical perspective, Bitcoin’s price action has painted a bull flag on the weekly chart, which hints at the continuation of the uptrend.
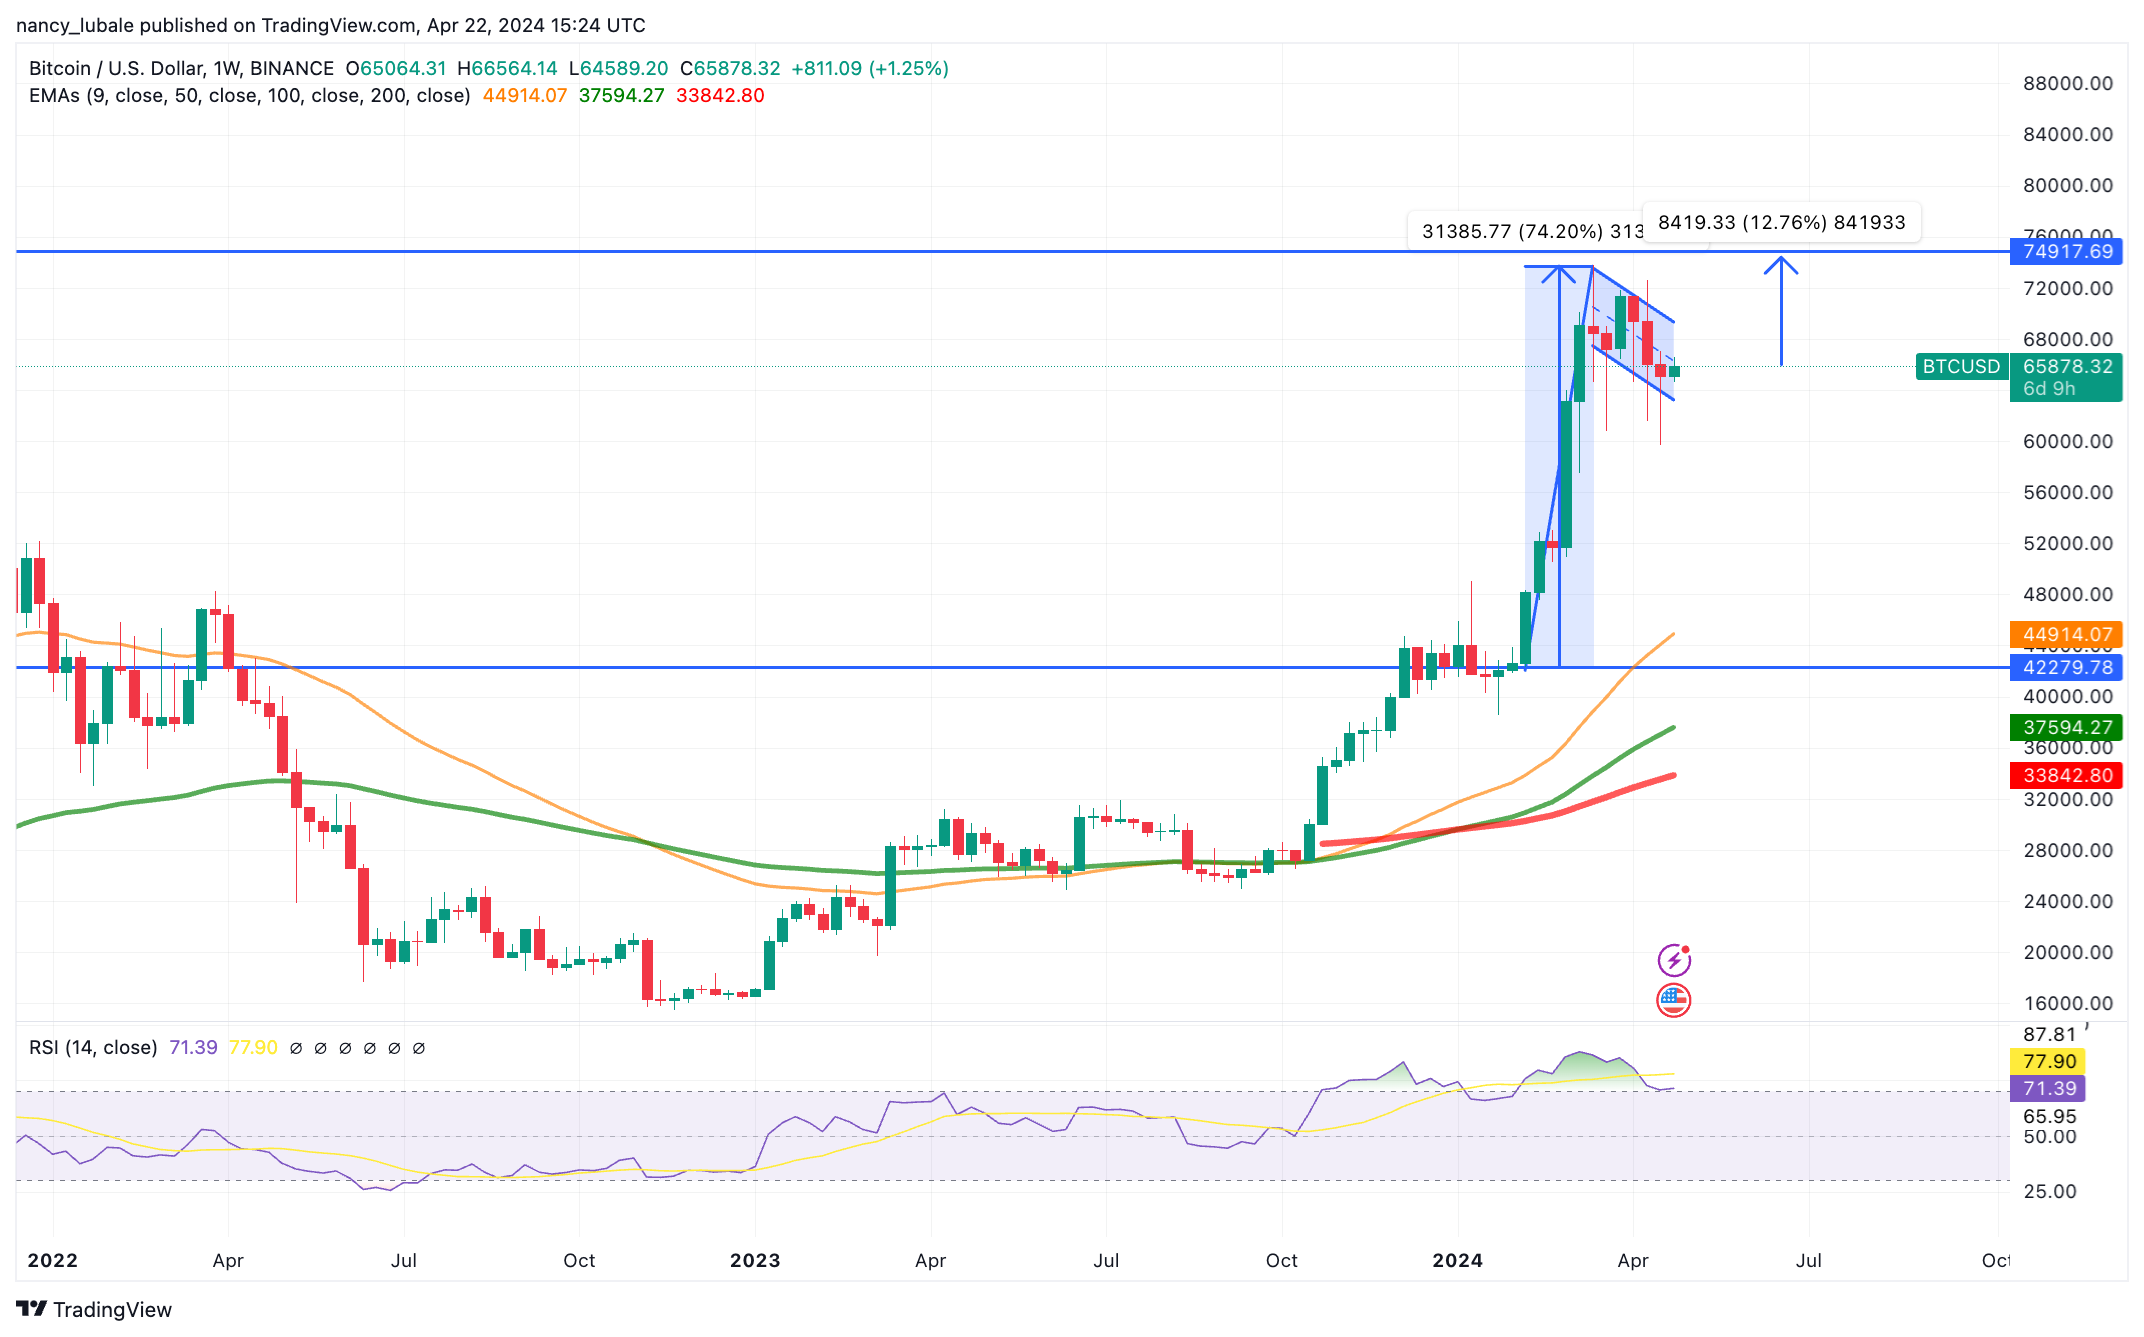
BTC bulls face resistance from the flag’s upper boundary at $67,500. A weekly candlestick close above this level would signal a possible breakout from the chart formation, clearing the path to the $73,835 all-time high and later to the $80,000 mark. Such a move would represent a 13% ascent from the current price.

Responses