4 reasons why Ethereum is finally topping out versus Bitcoin

The ETH/BTC pair is showing weakness today. Cointelegraph explains why.

Ethereum’s native cryptocurrency, Ether (ETH), has gained over 20% against Bitcoin (BTC) since Feb. 12. This notable surge has occurred primarily due to anticipations surrounding the potential approval of a spot Ether exchange-traded fund (ETF) in the United States by May of this year.
However, the widely-tracked ETH/BTC pair has reached a historical inflection point that could boost its correction risks in the coming days. Let’s explore these bearish setups in detail as follows.
Ethereum’s bearish fractal returns
Notably, the four-hour ETH/BTC chart below shows Ether treading around its 1.00 Fibonacci retracement level at 0.06044 BTC. In addition, its relative strength index (RSI) reading has turned “overbought” after crossing above 70, indicating a correction scenario.

The combination of these two technical data is very similar to the fractal from January 2024 that preceded a 11.65% drop in ETH/BTC rates.
Specifically, an overbought RSI combined with a historical resistance level heightens the likelihood of purchasing fatigue among investors. This scenario could lead to a downturn in Ethereum’s value relative to Bitcoin, beginning with a decline toward the 0.786 Fib line at 0.058 BTC.
A rising wedge pattern emerges
However, the presence of a rising wedge pattern, which is pending a bearish confirmation, has the potential to depress the ETH/BTC exchange rate further, targeting a decrease of 10.85% to a level of 0.053 BTC from its current position by March.

Rising wedge formations are generally considered bearish reversal indicators, suggesting a shift from upward to downward momentum.
ETH/BTC shows a descending triangle on the weekly chart
On the weekly timeframe chart, Ether shows signs of bearish reversal as it struggles to close above its multiyear descending trendline resistance. Interestingly, this trendline coincides with ETH/BTC’s 50-week exponential moving average (50-week EMA; the red wave).

This resistance confluence can limit Ether’s upside attempts in the coming weeks, making the cryptocurrency more prone to pursue a pullback toward 0.051 BTC, a level that has witnessed sharp rebounds in the June 2022 and October 2023–January 2024 sessions.
Related: ‘Pre-halving top’ due soon? 5 things to know in Bitcoin this week
Ethereum whale holdings drop
There’s also a significant divergence observed in the Ether and Bitcoin portfolios of major investors, often referred to as “whales.”
For instance, the number of entities that hold 1,000–100,000 ETH has dropped significantly in February, according to Glassnode data.

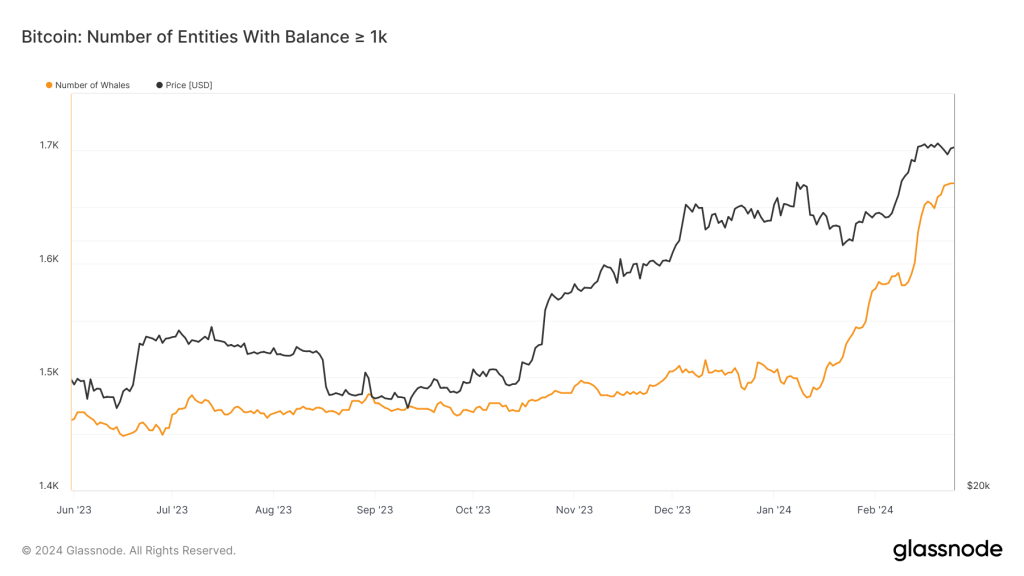
The number of Bitcoin entities possessing over 1,000 BTC has increased, a trend attributed to the surge in capital influx into recently introduced ETFs.

This essentially signifies a heightened interest in Bitcoin over Ether among institutional investors, strengthening ETH/BTC’s bearish case in addition to the technical factors.


Responses