BTC price shows $60K 'potential' as MVRV metric copies Bitcoin bull cycles

Bitcoin may see rapid 50% gains if MVRV behavior repeats the 2016 and 2020 runs to BTC price all-time highs.

Bitcoin (BTC) is primed for a “surge” as it channels classic bull market signals from the past, the latest research says.
In a post on X (formerly Twitter) on Jan. 30, popular social media commentator Ali eyed history repeating itself on a classic BTC price indicator.
MVRV hints at possible “extreme deviation” to come
Bitcoin may be struggling on lower timeframes in the wake of the spot exchange-traded fund (ETF) releases, but zooming out, the picture remains optimistic.
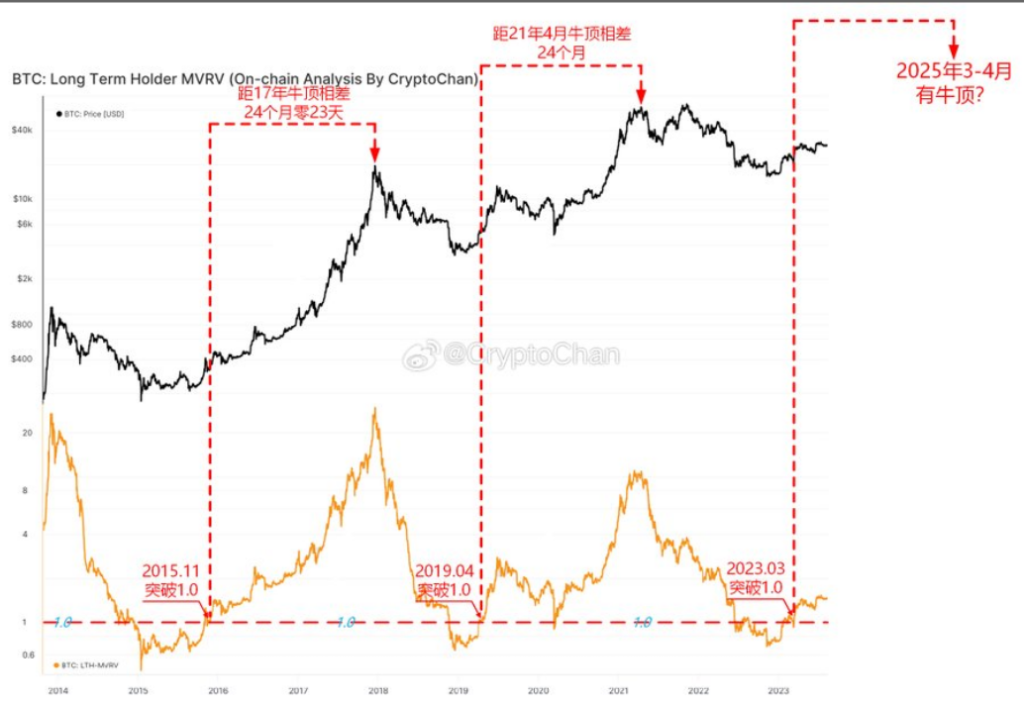
For Ali, one of various encouraging signs comes from the market value to realized value (MVRV) metric — a classic tool for measuring what on-chain analytics firm Glassnode calls Bitcoin’s “fair value.”
When MVRV deviates significantly from the mean, it tends to coincide with bull market tops and bear market bottoms.
Currently, BTC/USD MVRV is focusing on the mean level, crossing it from both above and below in a style that characterized both 2016 and 2020 — just before a run to all-time highs began.
“During past bull markets, Bitcoin rebounded strongly after touching the mean MVRV pricing band,” Ali wrote in accompanying comments.
“We’re witnessing a similar pattern now. With the recent bounce from the mean MVRV at $40,500, there’s potential for $BTC to surge to the 1.0 standard deviation line at $60,000!”

Earlier this week, Cointelegraph reported on a comedown in another gauge measuring stablecoin supply versus the BTC supply. The stablecoin supply ratio, or SSR, is now 80% below its own all-time high seen just three months ago — boosting the odds of a BTC price uptick in the process.
Bitcoin Ichimoku resistance mounts
Elsewhere, Ichimoku Cloud analysis likewise keeps the overall Bitcoin bull market narrative firmly alive.
Related: Bitcoin traders dismiss BTC price 2-week highs amid new liquidity drop
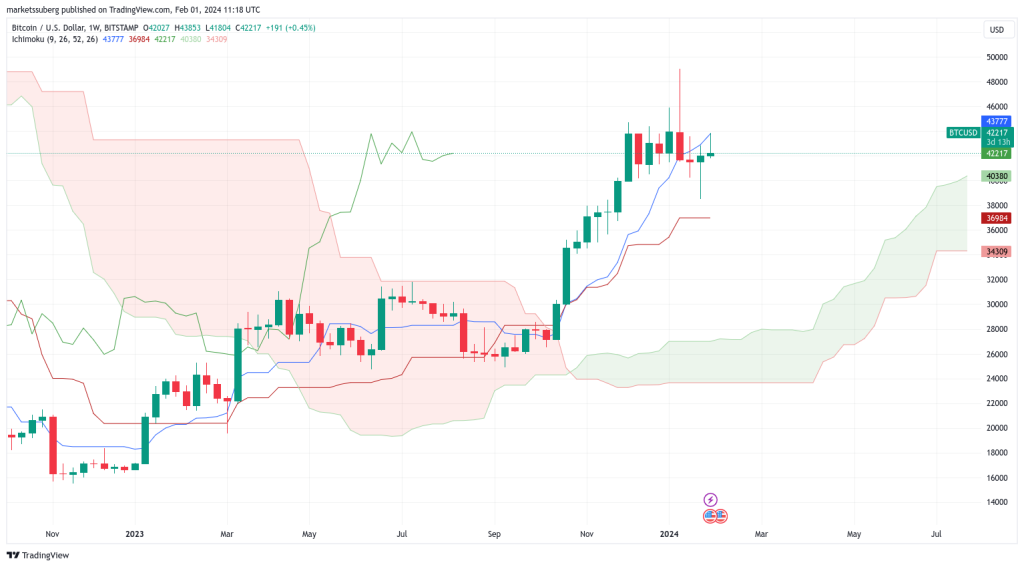
After the retreat from two-year highs of $49,000 earlier in January, Ichimoku’s previously highly bullish weekly chart setup also took some punishment.
Price sank below the Tenkan-sen conversion line and this has acted since as resistance, with price unable to ascend higher, data from Cointelegraph Markets Pro and TradingView confirms.

Analyzing the potential for a midterm top based on Ichimoku, however, popular trader CryptoCon warned that the January high may endure.
“People have said that there will be no more corrections with ETFs here, but that is obviously not true,” he told X subscribers in part of a post on Jan. 13.
CryptoCon concluded that “this time is not different until price clearly proves that it is, and it hasn’t.”
At the touch of 49k, #Bitcoin reached a very important point on the Weekly Ichimoku
The top of the red cloud.
This has marked the mid-top with very high accuracy in previous cycles, but in the event $49,100 was the high, this would have been pinpoint.
The high also came on the… pic.twitter.com/bC0xMNchMU
— CryptoCon (@CryptoCon_) January 13, 2024
This article does not contain investment advice or recommendations. Every investment and trading move involves risk, and readers should conduct their own research when making a decision.


… [Trackback]
[…] Read More Info here to that Topic: x.superex.com/news/bitcoin/3984/ […]
… [Trackback]
[…] Read More Information here to that Topic: x.superex.com/news/bitcoin/3984/ […]
… [Trackback]
[…] Find More on that Topic: x.superex.com/news/bitcoin/3984/ […]
… [Trackback]
[…] Find More here on that Topic: x.superex.com/news/bitcoin/3984/ […]
… [Trackback]
[…] Info to that Topic: x.superex.com/news/bitcoin/3984/ […]
… [Trackback]
[…] Find More Information here on that Topic: x.superex.com/news/bitcoin/3984/ […]
… [Trackback]
[…] Find More Info here on that Topic: x.superex.com/news/bitcoin/3984/ […]
… [Trackback]
[…] Find More on that Topic: x.superex.com/news/bitcoin/3984/ […]
… [Trackback]
[…] Read More here on that Topic: x.superex.com/news/bitcoin/3984/ […]
… [Trackback]
[…] Info to that Topic: x.superex.com/news/bitcoin/3984/ […]
… [Trackback]
[…] Here you can find 45379 additional Info on that Topic: x.superex.com/news/bitcoin/3984/ […]
… [Trackback]
[…] Read More here to that Topic: x.superex.com/news/bitcoin/3984/ […]
… [Trackback]
[…] Read More to that Topic: x.superex.com/news/bitcoin/3984/ […]
… [Trackback]
[…] There you can find 58898 more Info to that Topic: x.superex.com/news/bitcoin/3984/ […]
… [Trackback]
[…] Read More on that Topic: x.superex.com/news/bitcoin/3984/ […]
… [Trackback]
[…] Find More on that Topic: x.superex.com/news/bitcoin/3984/ […]
… [Trackback]
[…] Here you will find 19915 more Info to that Topic: x.superex.com/news/bitcoin/3984/ […]
… [Trackback]
[…] Information to that Topic: x.superex.com/news/bitcoin/3984/ […]
… [Trackback]
[…] Information on that Topic: x.superex.com/news/bitcoin/3984/ […]
… [Trackback]
[…] There you can find 85998 additional Info on that Topic: x.superex.com/news/bitcoin/3984/ […]
… [Trackback]
[…] Info on that Topic: x.superex.com/news/bitcoin/3984/ […]
… [Trackback]
[…] Information to that Topic: x.superex.com/news/bitcoin/3984/ […]