Bitcoin faces ‘very limited liquidity’ as BTC price pushed below $43K

Bitcoin faces an uphill struggle after last week’s 15% BTC price losses, and the recovery process may need more than a month.

Bitcoin (BTC) saw rangebound swings on Jan. 15 as one analyst warned over order book liquidity.

Analysis: Bitcoin may need weeks to recover
Data from Cointelegraph Markets Pro and TradingView tracked a trip to near $43,000 before BTC price volatility returned, sending the market down 1.5% in an hour.
The moves occurred on a Wall Street holiday, leaving the door open to more erratic price behavior.
In his latest posts on X (formerly Twitter), popular trader Skew noted that spot markets broadly lacked sufficient depth to ensure stability on low timeframes.
“Currently there’s very limited liquidity so expecting some kind of 1K candle to come out of nowhere later,” he wrote just before volatility hit.
“Above $42.8K, bulls can flex some muscle below yearly open market is vulnerable, bears could take control.”
The $43,000 round trip, Skew added, had been led by derivatives — and was thus likely unsustainable.
$BTC
Perp driven LTF spike, needs to be spot driven to actually sustain & accept above $42.8K imospot driven means price led higher by limit & taker spot bid, which here it wasn’t pic.twitter.com/OzjejKNYSg
— Skew Δ (@52kskew) January 15, 2024
Considering how long BTC/USD might be licking its wounds after last week’s 15% dive, meanwhile, analyst Matthew Hyland saw the recovery potentially taking more than a month.
“Bitcoin may be about to go sideways here for a little while,” he commented alongside a chart showing buy and sell volumes.
“The last 4 times we saw this much red volume on the weekly; there was a minimum of 3-4 weeks of sideways price action. This environment would be beneficial for Ethereum+Alts if the dominance breaks down.”

The chart drew comparisons between last week’s panic selling and the atmosphere at the end of Bitcoin’s 2022 bear market.
One month left for a BTC price crash?
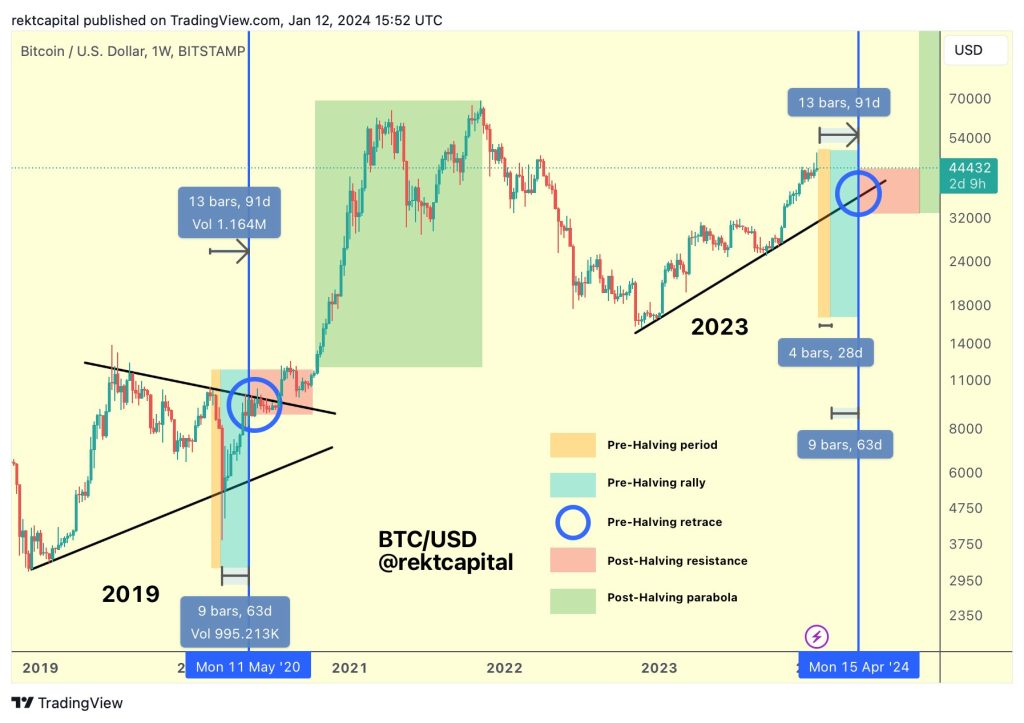
Turning to what comes thereafter, fellow popular trader and analyst Rekt Capital laid out the possible roadmap for BTC price action prior to April’s block subsidy halving.
Related: BTC speculators dump $5B — 5 things to know in Bitcoin this week
Any last-minute gains, he showed, show themselves around two months prior to the event — giving bears precious little time to effect any major comedown.
“If BTC is going to perform a deeper retrace during its Pre-Halving period (orange), it should occur over the next 30 days or so,” part of a commentary on an accompanying chart summarized.

A subsequent X post additionally placed BTC/USD firmly within its established weekly trading range despite recent volatility.
#BTC still in its Weekly range$BTC #Crypto #Bitcoin pic.twitter.com/gjJqOZTo63
— Rekt Capital (@rektcapital) January 15, 2024
This article does not contain investment advice or recommendations. Every investment and trading move involves risk, and readers should conduct their own research when making a decision.


… [Trackback]
[…] Read More here on that Topic: x.superex.com/news/bitcoin/2628/ […]
… [Trackback]
[…] Read More on that Topic: x.superex.com/news/bitcoin/2628/ […]
… [Trackback]
[…] Read More Info here on that Topic: x.superex.com/news/bitcoin/2628/ […]
… [Trackback]
[…] Here you can find 46500 more Information on that Topic: x.superex.com/news/bitcoin/2628/ […]
… [Trackback]
[…] There you can find 79771 more Info to that Topic: x.superex.com/news/bitcoin/2628/ […]
… [Trackback]
[…] Find More Info here to that Topic: x.superex.com/news/bitcoin/2628/ […]
… [Trackback]
[…] Find More on that Topic: x.superex.com/news/bitcoin/2628/ […]
… [Trackback]
[…] Find More here to that Topic: x.superex.com/news/bitcoin/2628/ […]
… [Trackback]
[…] Find More on that Topic: x.superex.com/news/bitcoin/2628/ […]
… [Trackback]
[…] Read More on that Topic: x.superex.com/news/bitcoin/2628/ […]
… [Trackback]
[…] Read More Info here on that Topic: x.superex.com/news/bitcoin/2628/ […]
… [Trackback]
[…] Read More here on that Topic: x.superex.com/news/bitcoin/2628/ […]
… [Trackback]
[…] Read More here to that Topic: x.superex.com/news/bitcoin/2628/ […]
… [Trackback]
[…] Read More to that Topic: x.superex.com/news/bitcoin/2628/ […]
… [Trackback]
[…] Read More here on that Topic: x.superex.com/news/bitcoin/2628/ […]
… [Trackback]
[…] Read More to that Topic: x.superex.com/news/bitcoin/2628/ […]
… [Trackback]
[…] Find More on on that Topic: x.superex.com/news/bitcoin/2628/ […]
… [Trackback]
[…] Info to that Topic: x.superex.com/news/bitcoin/2628/ […]
… [Trackback]
[…] Find More here on that Topic: x.superex.com/news/bitcoin/2628/ […]
… [Trackback]
[…] Read More to that Topic: x.superex.com/news/bitcoin/2628/ […]
… [Trackback]
[…] Find More on on that Topic: x.superex.com/news/bitcoin/2628/ […]
… [Trackback]
[…] There you will find 24146 more Info to that Topic: x.superex.com/news/bitcoin/2628/ […]
… [Trackback]
[…] Read More on to that Topic: x.superex.com/news/bitcoin/2628/ […]
… [Trackback]
[…] Find More to that Topic: x.superex.com/news/bitcoin/2628/ […]
… [Trackback]
[…] Read More Information here on that Topic: x.superex.com/news/bitcoin/2628/ […]
… [Trackback]
[…] Info on that Topic: x.superex.com/news/bitcoin/2628/ […]
… [Trackback]
[…] Read More on that Topic: x.superex.com/news/bitcoin/2628/ […]
… [Trackback]
[…] Find More on that Topic: x.superex.com/news/bitcoin/2628/ […]
… [Trackback]
[…] Info on that Topic: x.superex.com/news/bitcoin/2628/ […]
… [Trackback]
[…] Find More on that Topic: x.superex.com/news/bitcoin/2628/ […]