BTC price suddenly drops 5% as Bitcoin rejects low CPI print
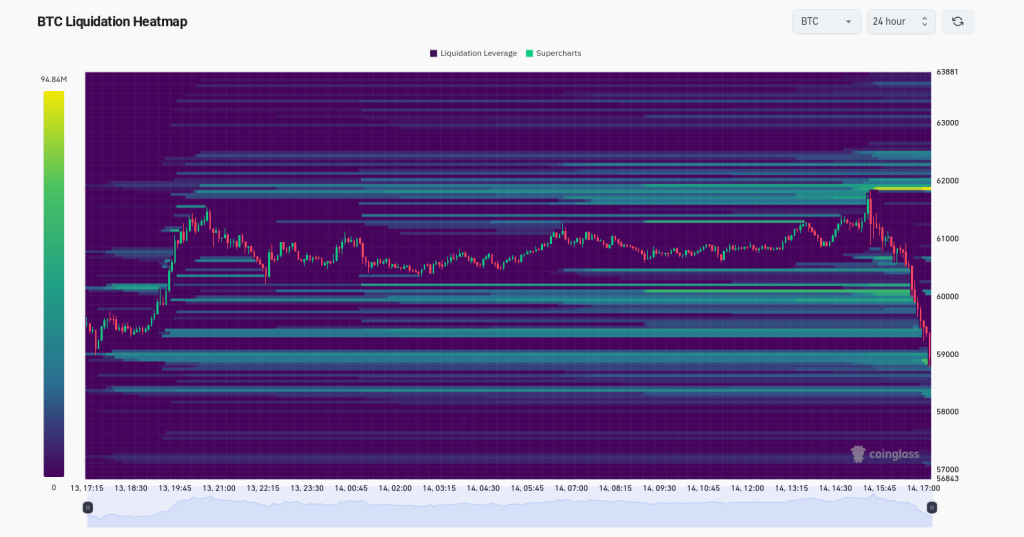
Bitcoin shrugs off notionally good news on US inflation with a BTC price plunge below $59,000.

Bitcoin (BTC) delivered classic “fakeout” moves around the Aug. 14 Wall Street open as bulls lost out on United States macro data.
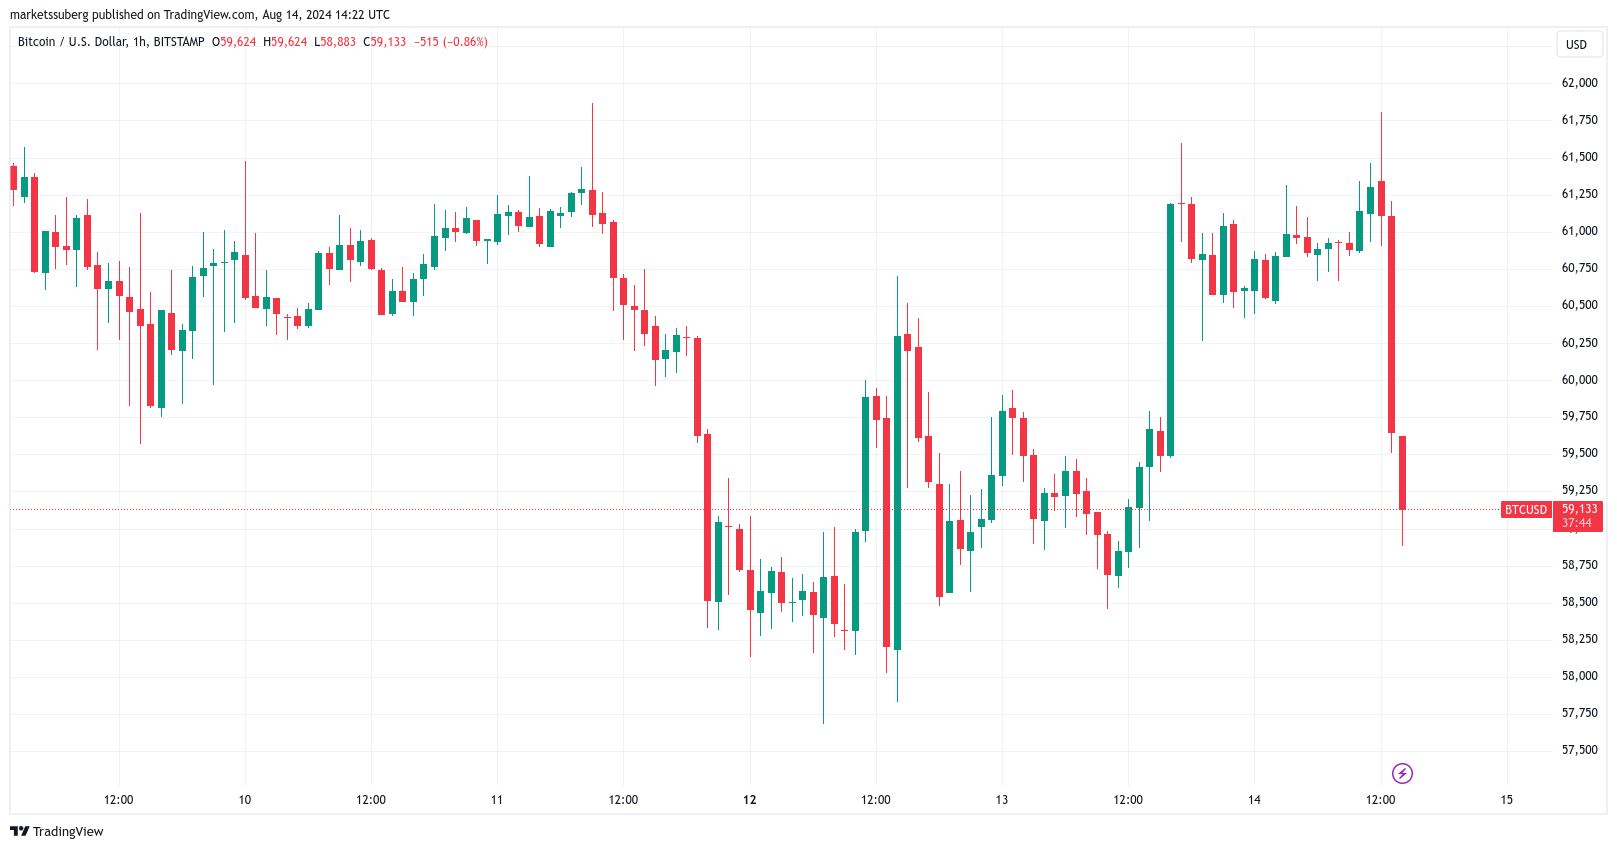
BTC price sheds $3,000 despite positive CPI
Data from Cointelegraph Markets Pro and TradingView showed BTC price action spiking to near $62,000 on the back of the latest Consumer Price Index (CPI) print.
Coming in below expectations, the result was slated to boost risk assets and crypto, but Bitcoin’s reaction was short-lived.
After hitting $61,809 on Bitstamp, BTC/USD fell by more than 3% in just over an hour.
Responding, popular trader Daan Crypto Trades, who had earlier warned about erratic BTC price moves around US macro data prints, was relieved.
“CPI Coming in mostly at estimates. Pretty good and doubt this impact markets much in the end,” he wrote in a post on X.
“Likely for the markets to do whatever they wanted to do anyways. At least no crazy upside or downside surprise is good.”
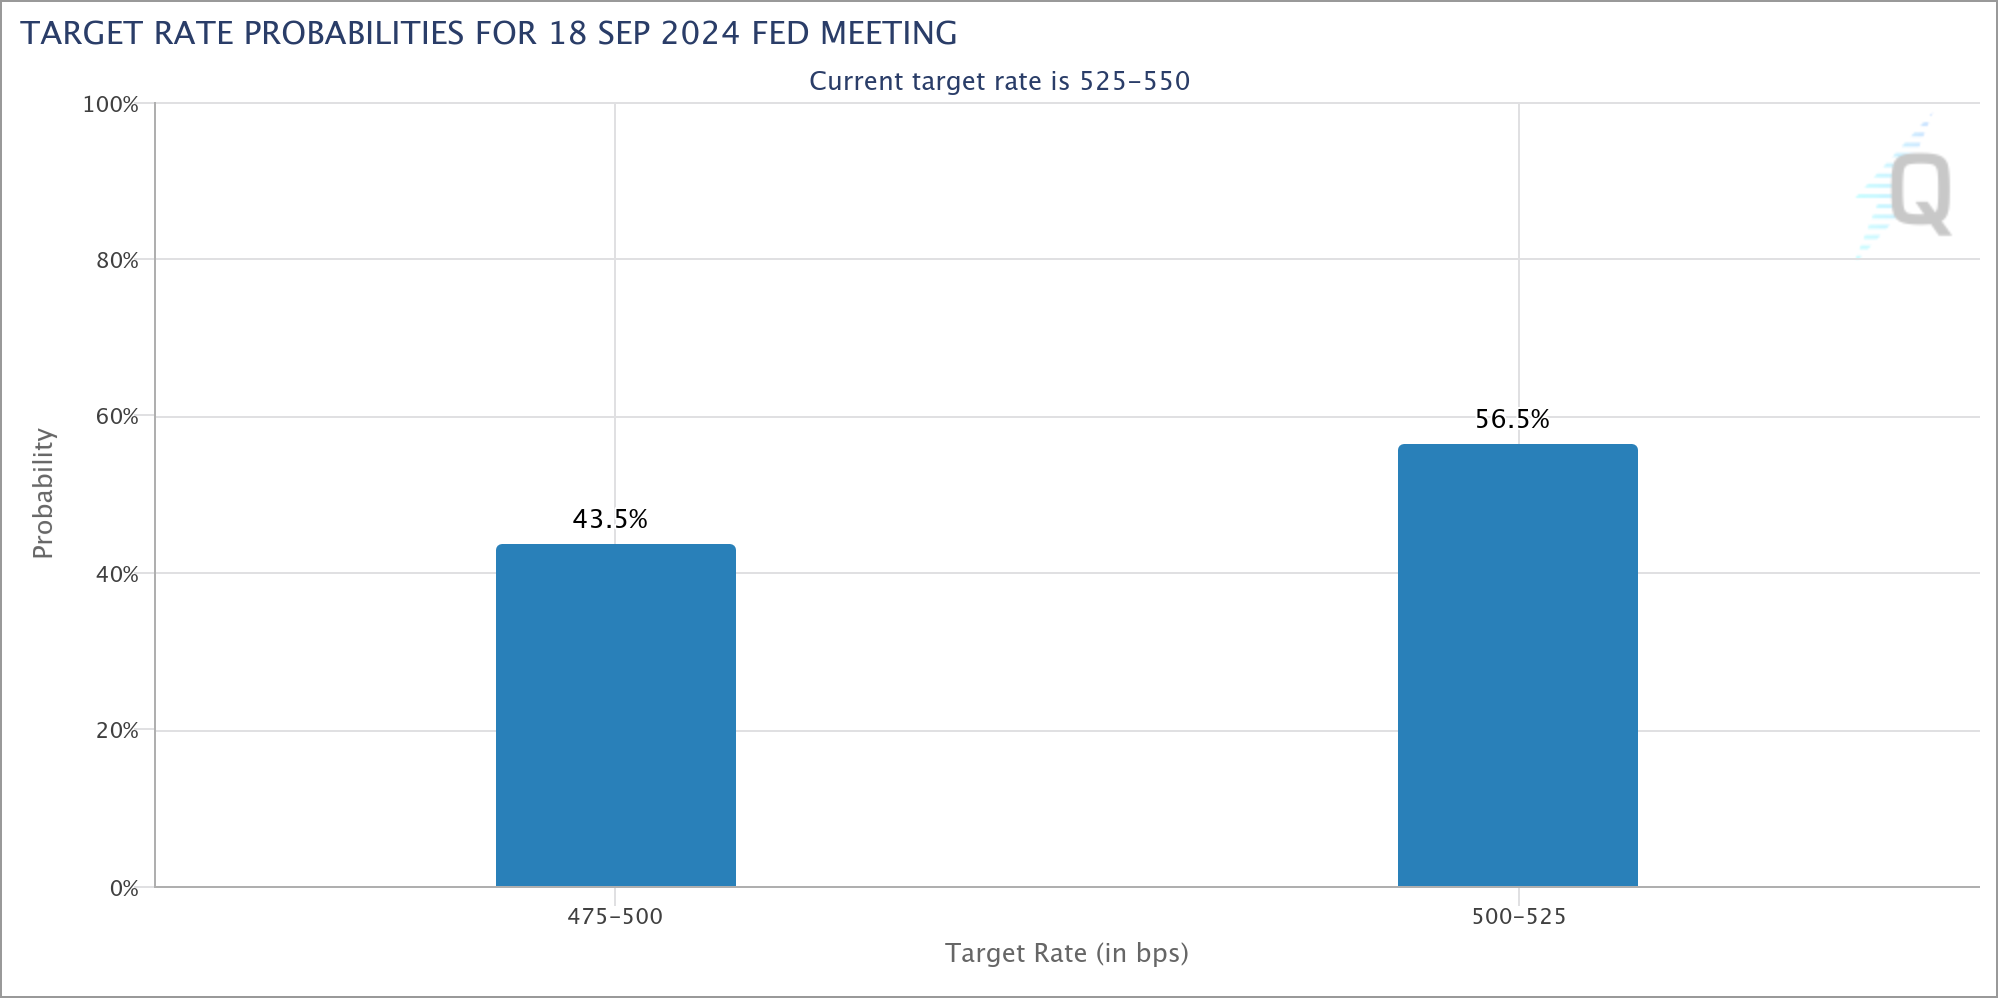
The latest data from CME Group’s FedWatch Tool revealed that markets continued to favor a small interest rate cut at the Federal Reserve’s next meeting in September.
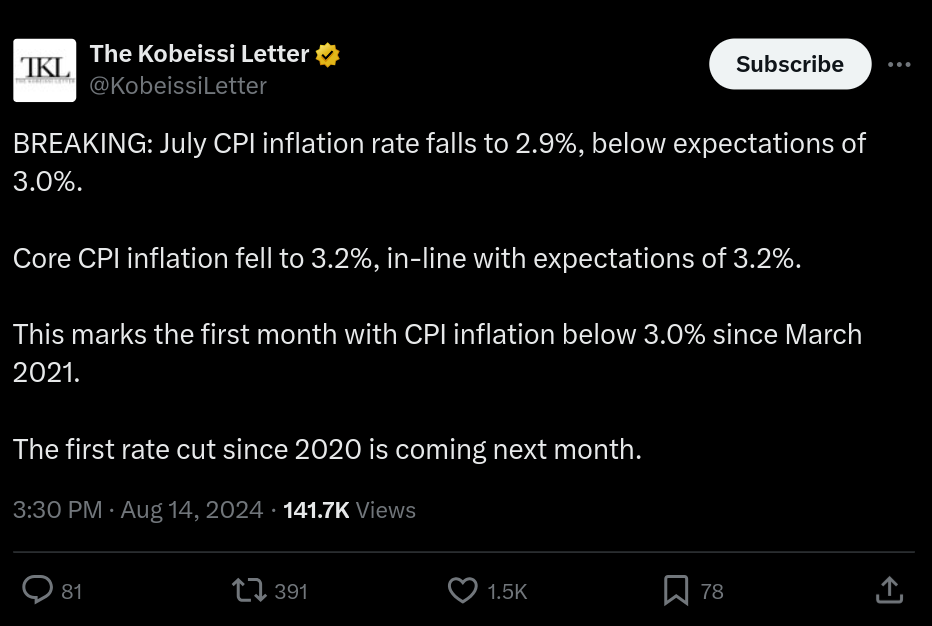
“As headline inflation comes down, Fed rate cuts are on the way,” trading resource The Kobeissi Letter continued in part of its own X coverage.
“However, as rate cuts come, inflation in some categories will begin rising again.”
Bitcoin trader eyes $55,000 for long entry
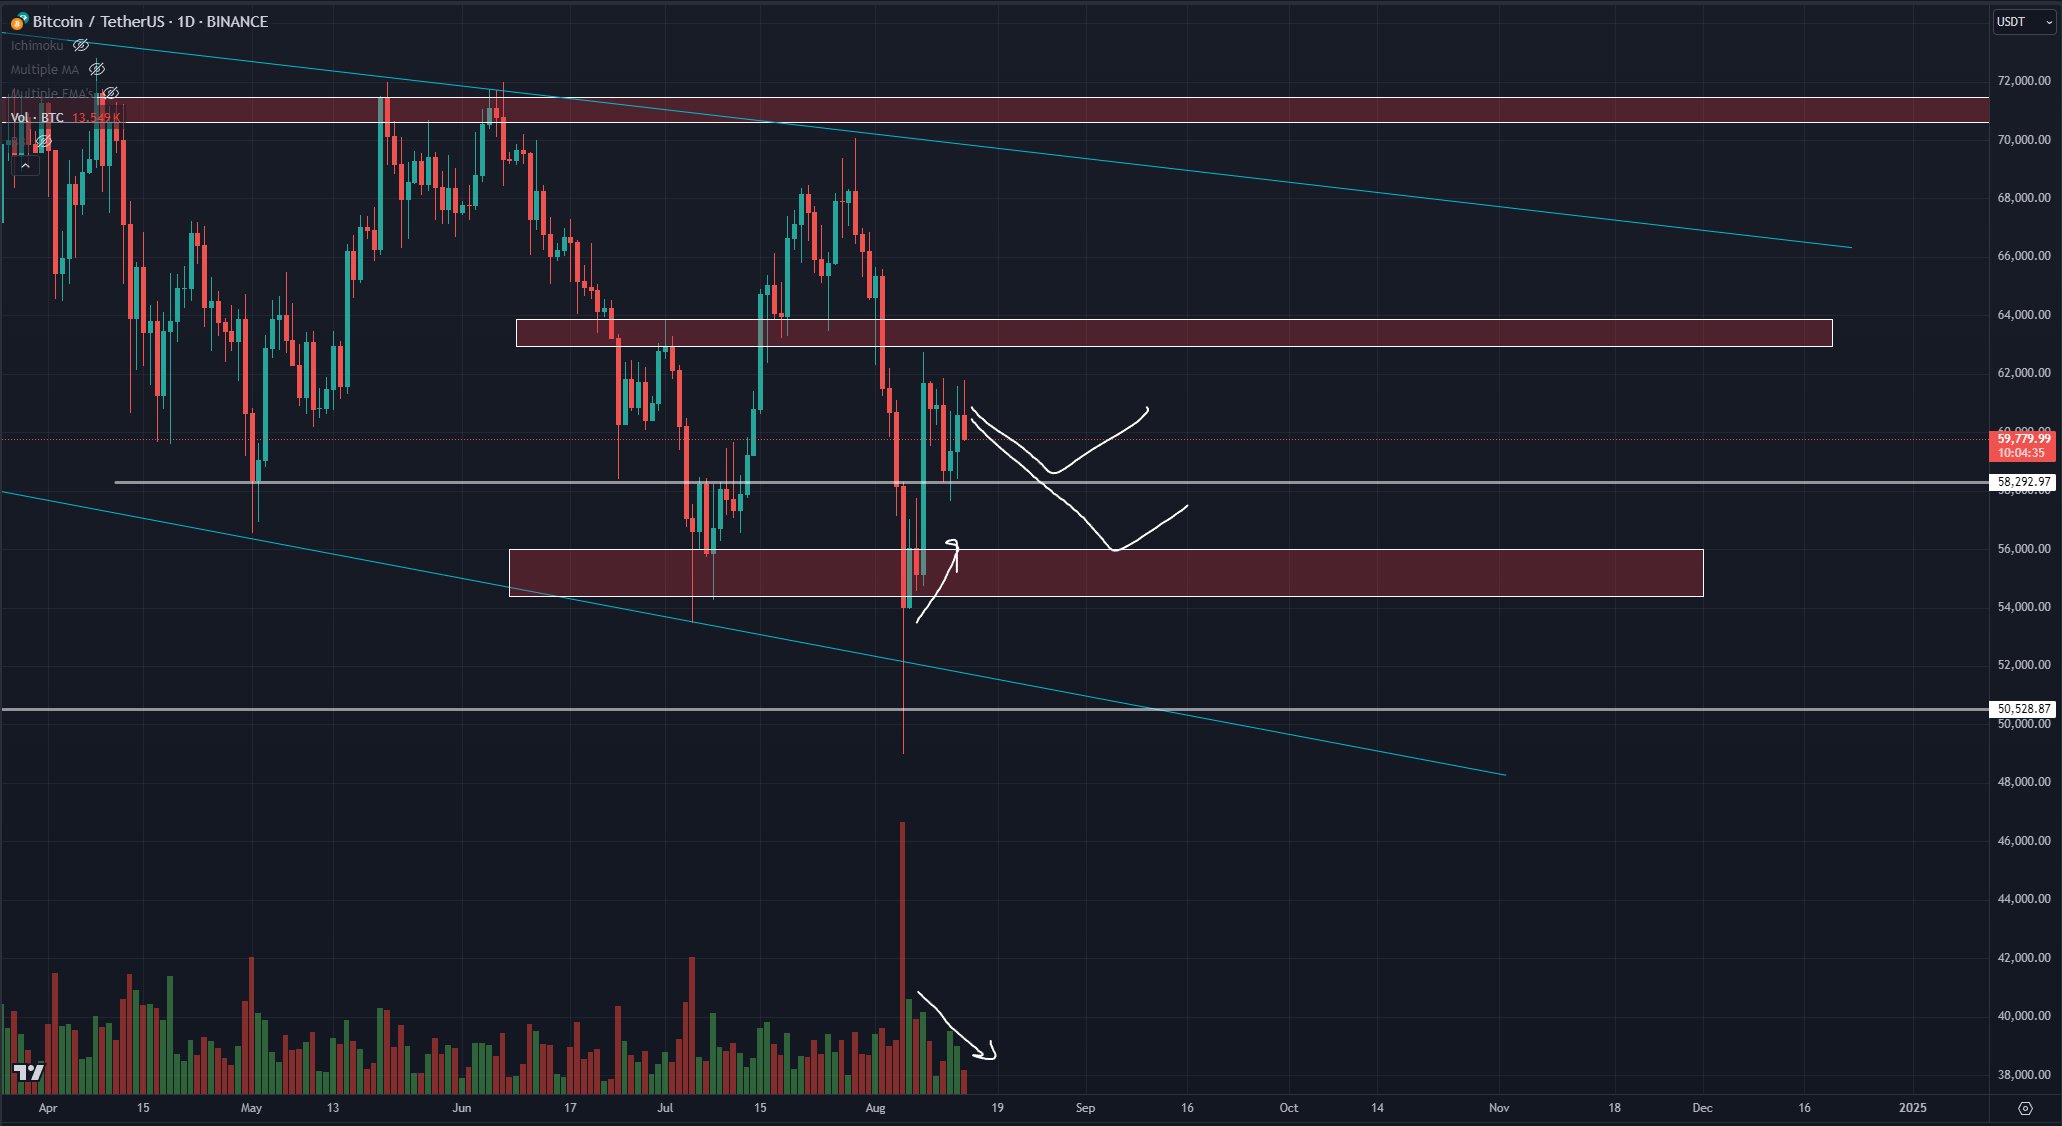
Eyeing potential market entries, fellow trader Roman suggested that Bitcoin could easily fall by another 10% from current levels.
Related: 45% of Bitcoin supply has not moved in 6 months — Research
The markets, he argued, lacked suitable volume to sustain higher prices.
“Looking for price to hit 58 & possibly 55k before potentially taking longs,” he told X followers.
“My plan has remained unchanged for the last week. Not seeing strength here for continuation upwards as we have bearish price action (low vol + price up).”
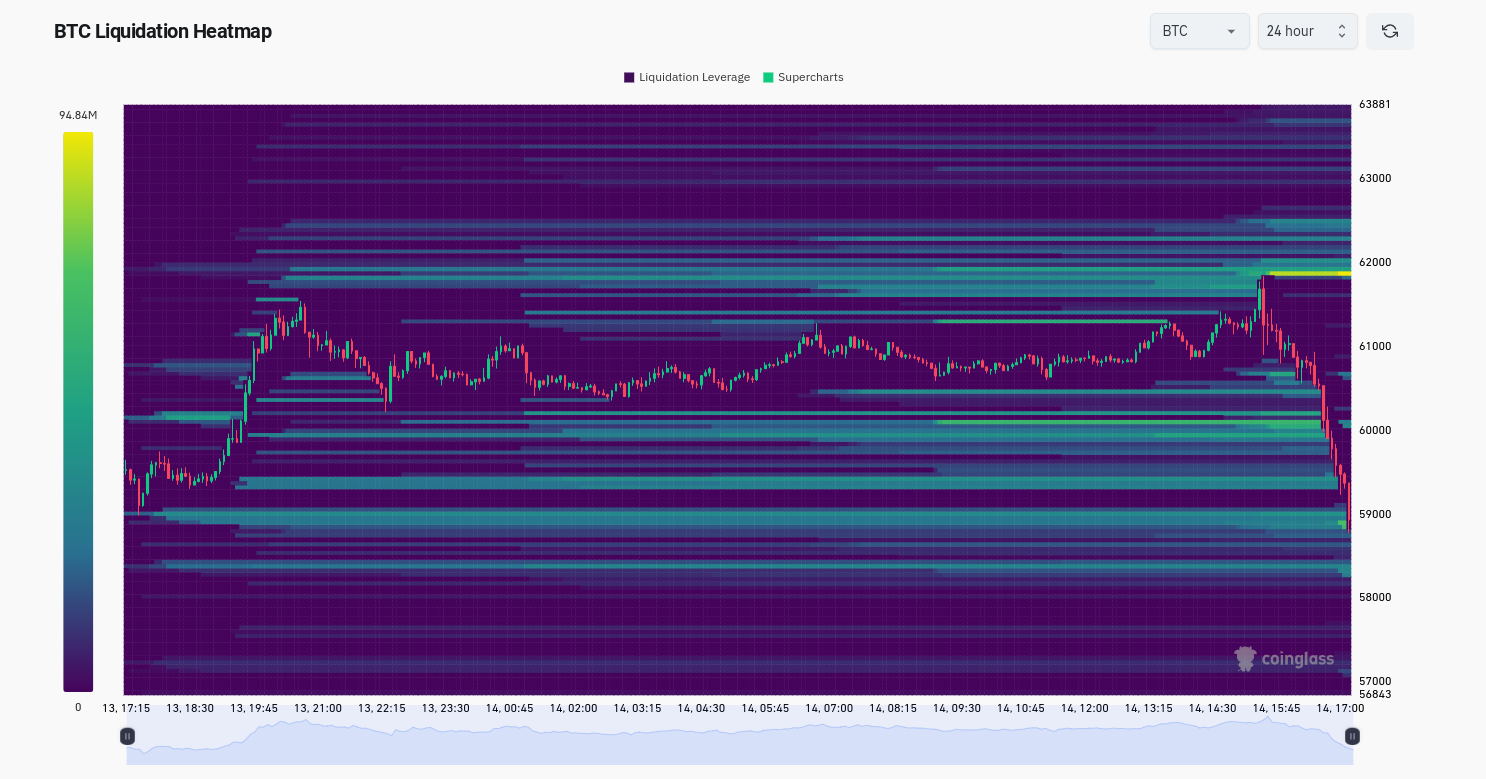
showed price cutting through bids while a new line of resistance was being stacked at $61,900.
This article does not contain investment advice or recommendations. Every investment and trading move involves risk, and readers should conduct their own research when making a decision.



Responses