Pepe memecoin hits record high but risks a brutal 40% crash by June
PEPE’s ongoing trend mirrors the price behavior that happened before a 40% crash in January.

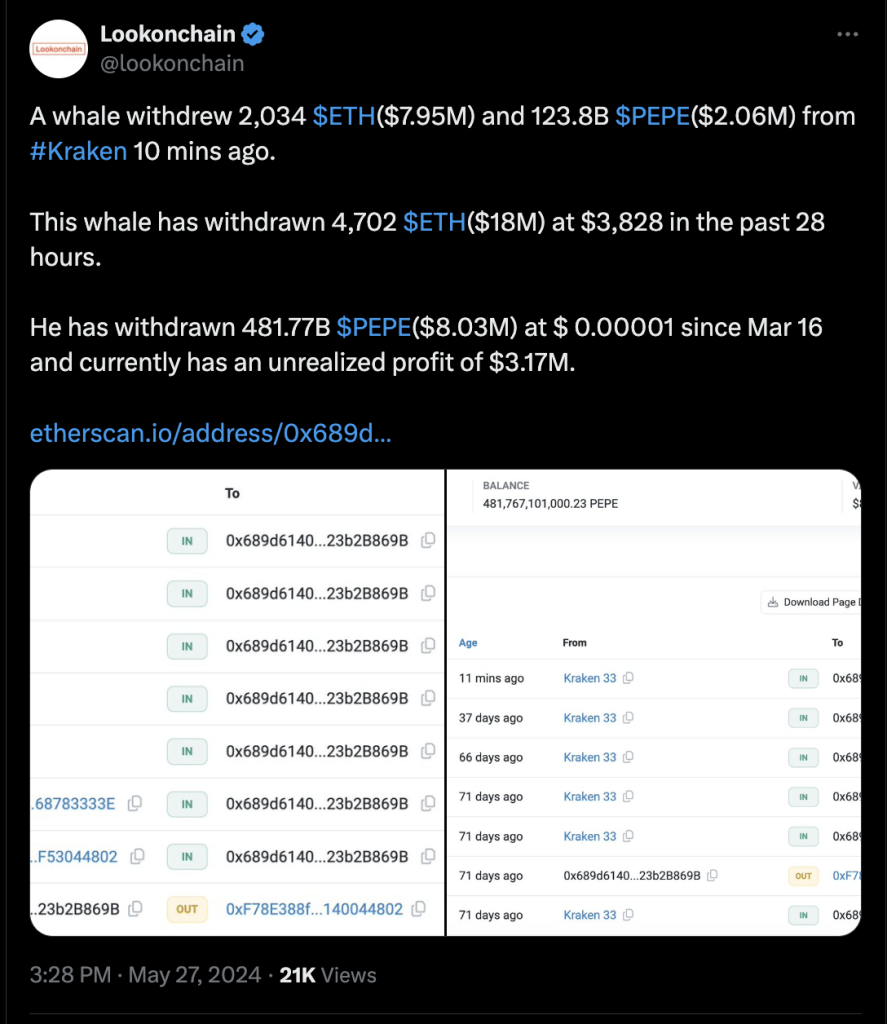
Pepe (PEPE) price rose to a record high on May 27, a surge driven by the recent approval of key Ether (ETH) exchange-traded fund (ETF) filings in the U.S., prompting traders to view Ethereum-based memecoins as high-risk, high-reward opportunities.
PEPE’s price surged by 7.60%, reaching an all-time high of $0.00001725. This marks an impressive 88% increase since the U.S. Securities and Exchange Commission (SEC) approved the Ether ETF filings on May 20.
Other Ethereum-standard memecoins, including Dogecoin (DOGE), Shiba Inu (SHIB), and Mog Coin (MOG), also posted significant gains after the ETF filings approval.
PEPE fractal hints at a 40% price correction in June
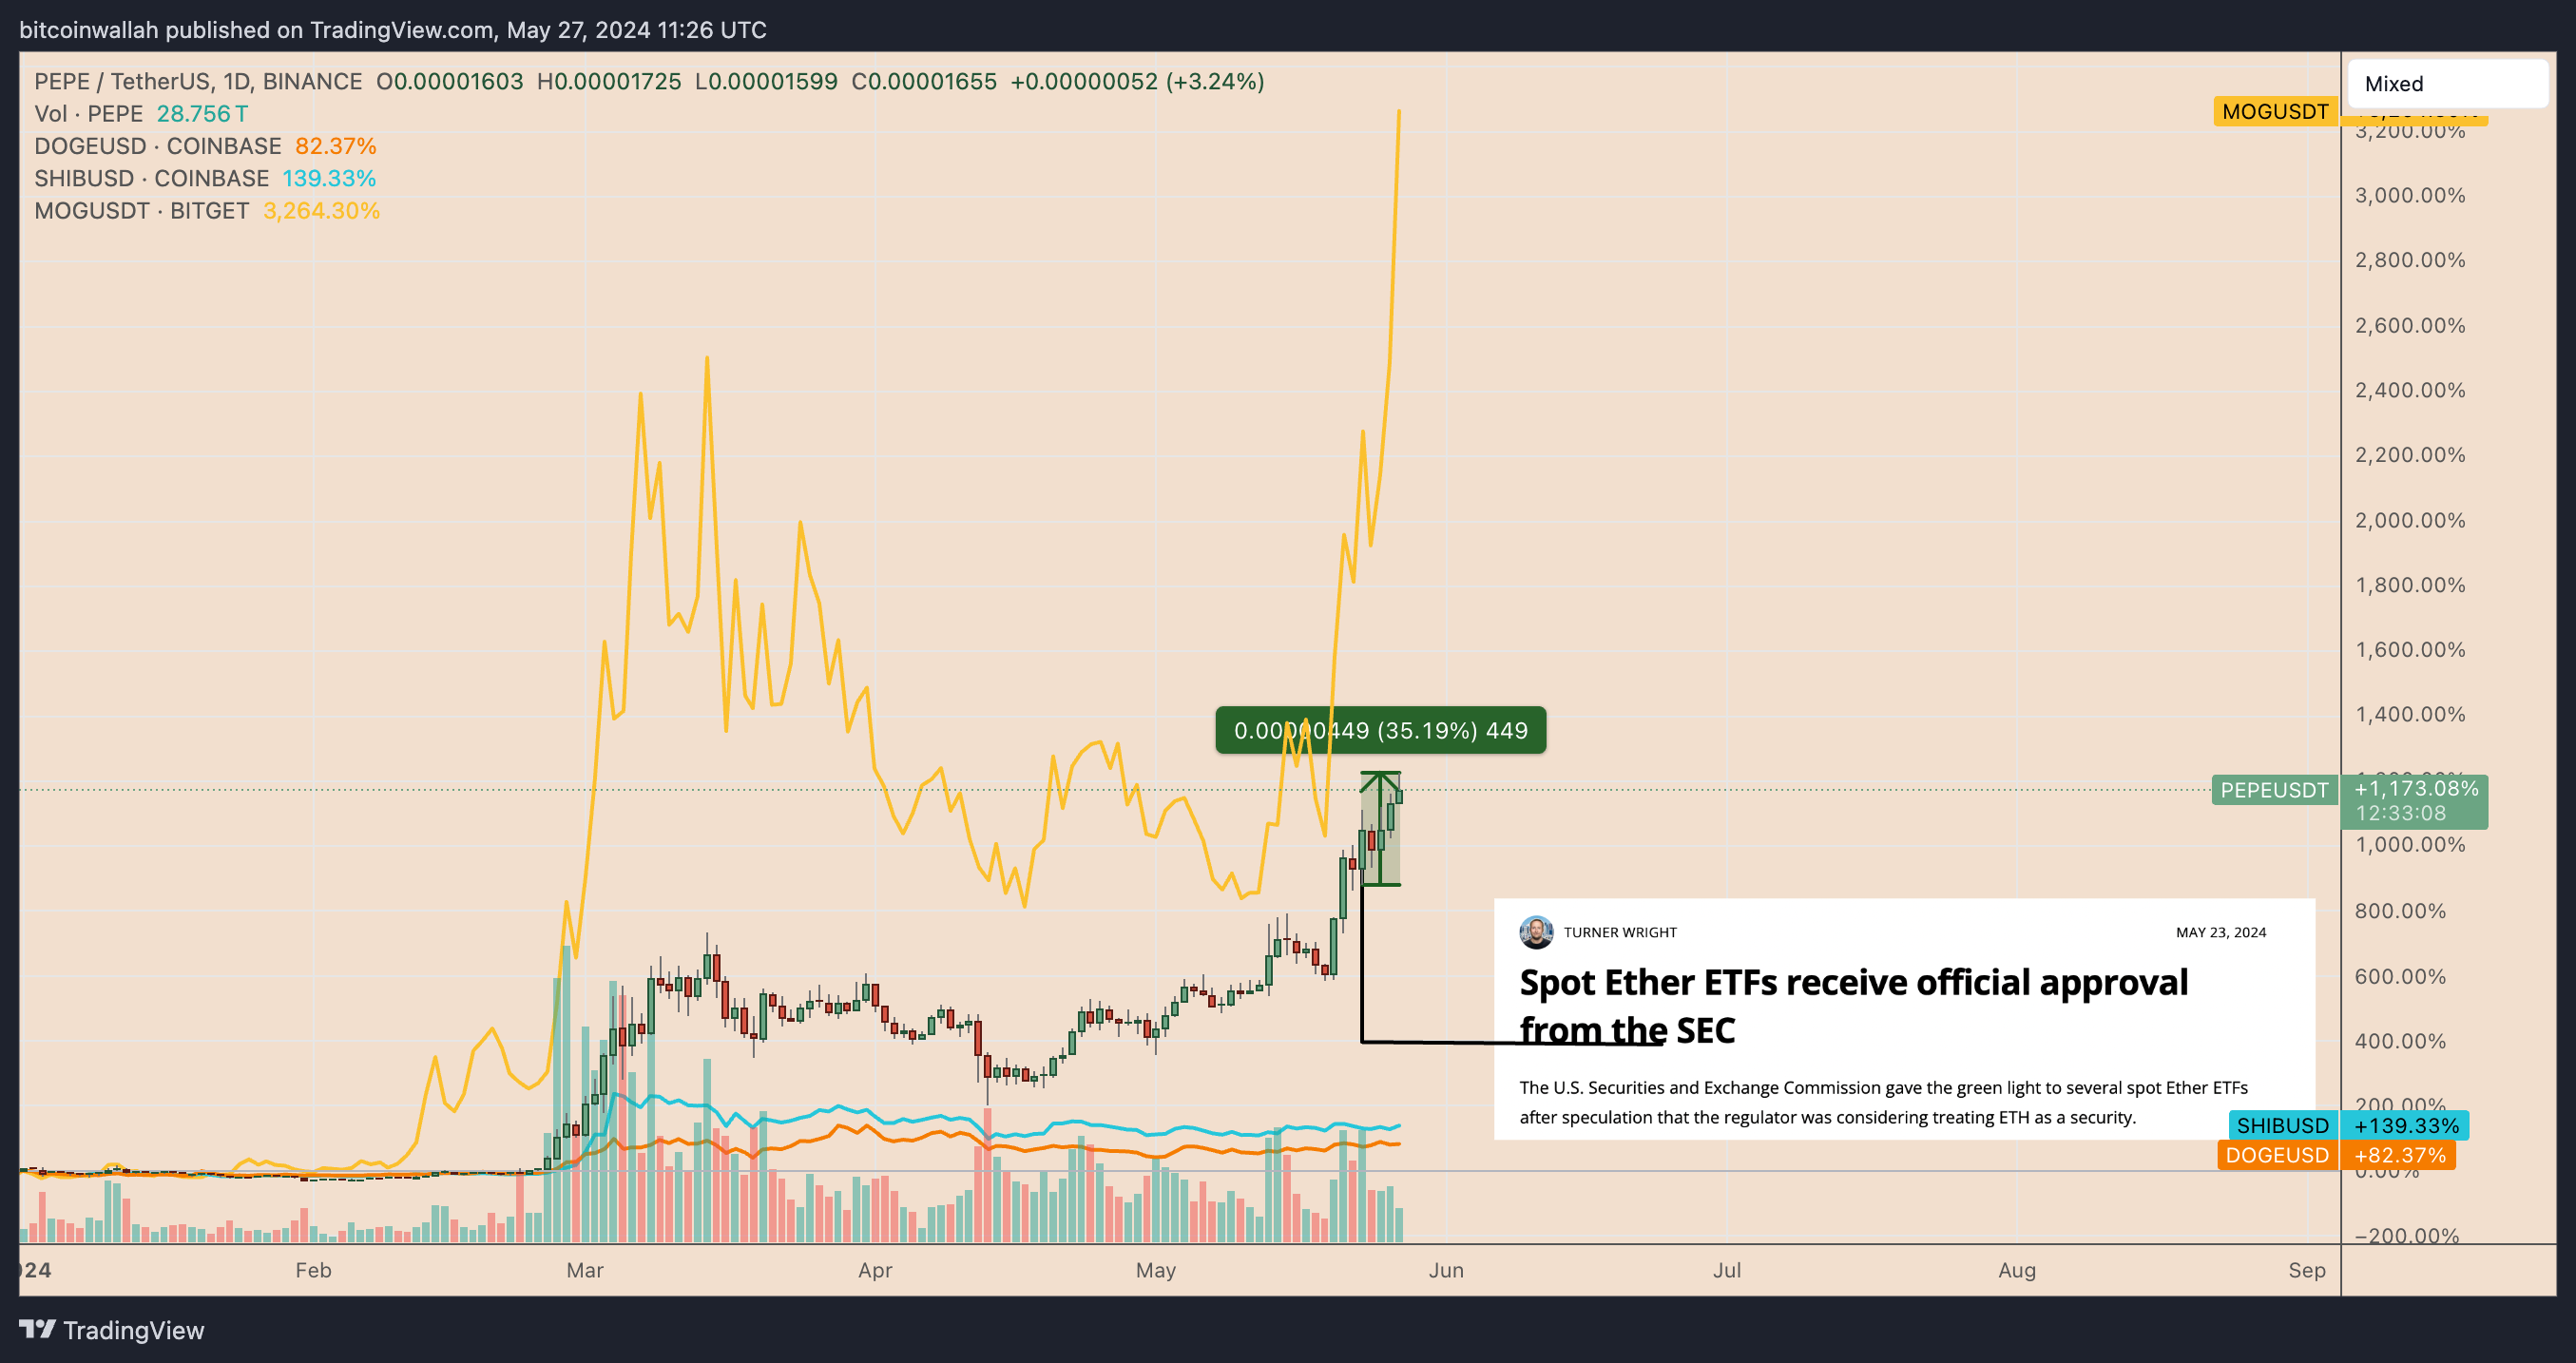
The ongoing run-up in the Pepe market may exhaust in the coming weeks due to a growing divergence between its rising prices and falling daily relative strength index (RSI).
PEPE’s “bearish divergence” suggests that the upward momentum is weaker than the rising price action indicates and could signal a potential price reversal. This situation is similar to the memecoins’ 40% crash in January, which followed a noticeable divergence between their increasing prices and declining RSI trends.
In addition, PEPE’s daily RSI has already crossed over 70, an overbought area that typically precedes a period of price correction or consolidation. This further increases sell-off risks in the PEPE market after its yearlong strong performance.
Related: Trader nets $2.7M profit in 3 days with Trump-themed MAGA memecoin
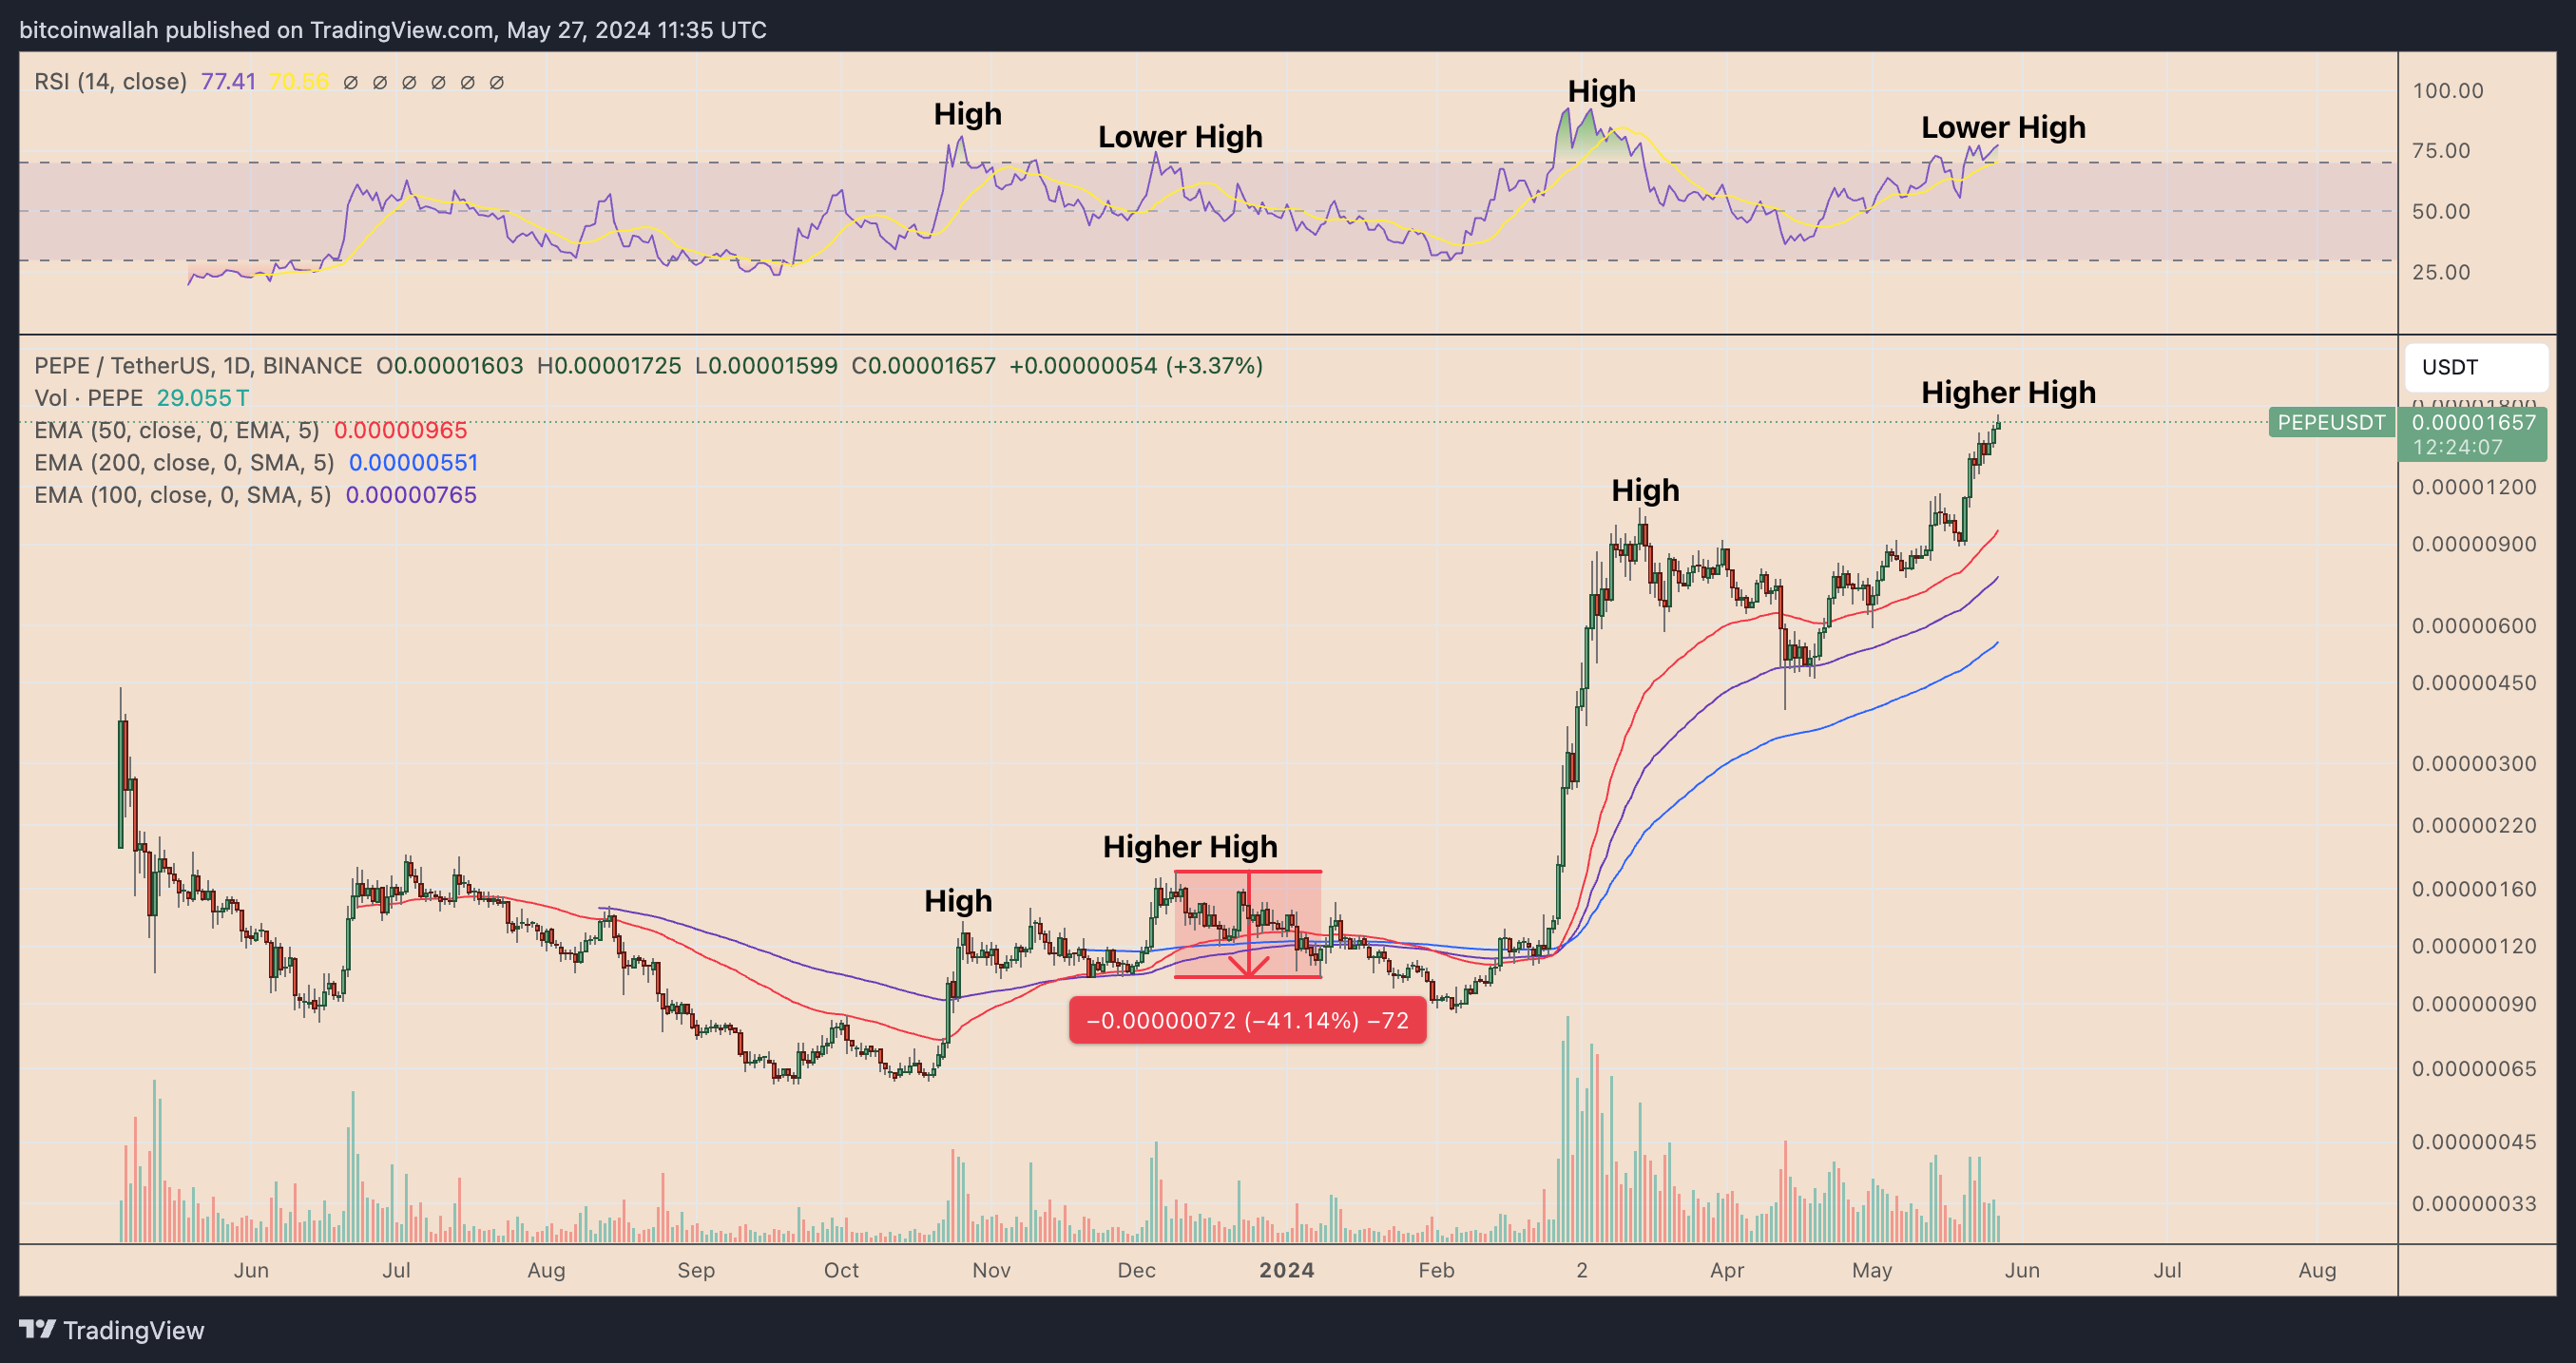
In an event of a correction, PEPE’s price may fall toward its 50-day exponential moving average (50-day EMA; the red wave) at around $0.00000965 by June, down about 40% from the current price levels. That is akin to its price correction preceding its bearish divergence signal in January
Conversely, a continued uptrend may see PEPE testing its 2.618 Fibonacci retracement level near $0.00002203 in the coming weeks, up by approximately 32% from current price levels.
Richest PEPE investors are dumping
PEPE’s bearish technical outlook is further reinforced by the ongoing profit-taking activities of its wealthiest investors.
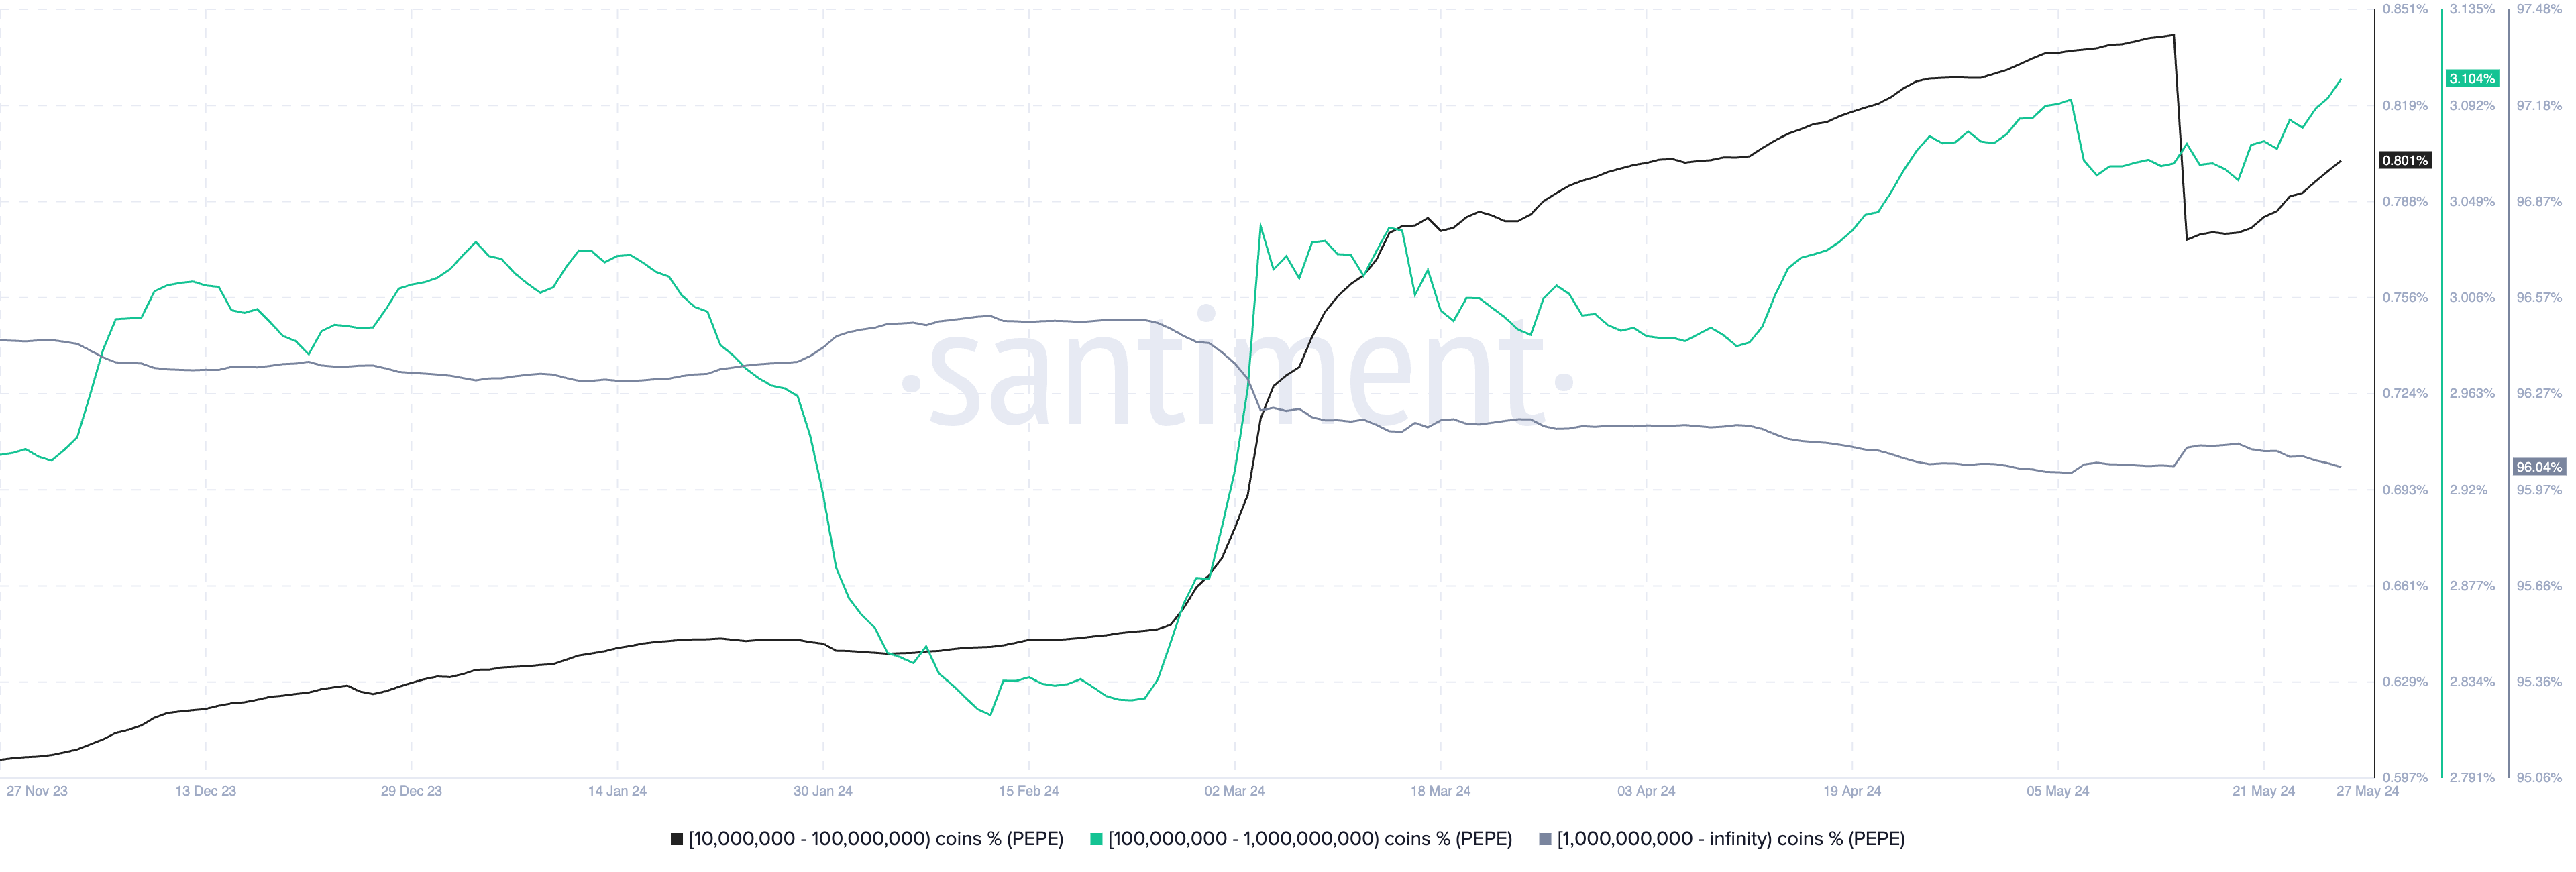
Notably, during the market uptrend, the supply of PEPE held by entities with balances exceeding 1 billion tokens has decreased. This indicates that these “whales” have been selling at local price peaks. Consequently, the supply of PEPE held by smaller investors has increased.
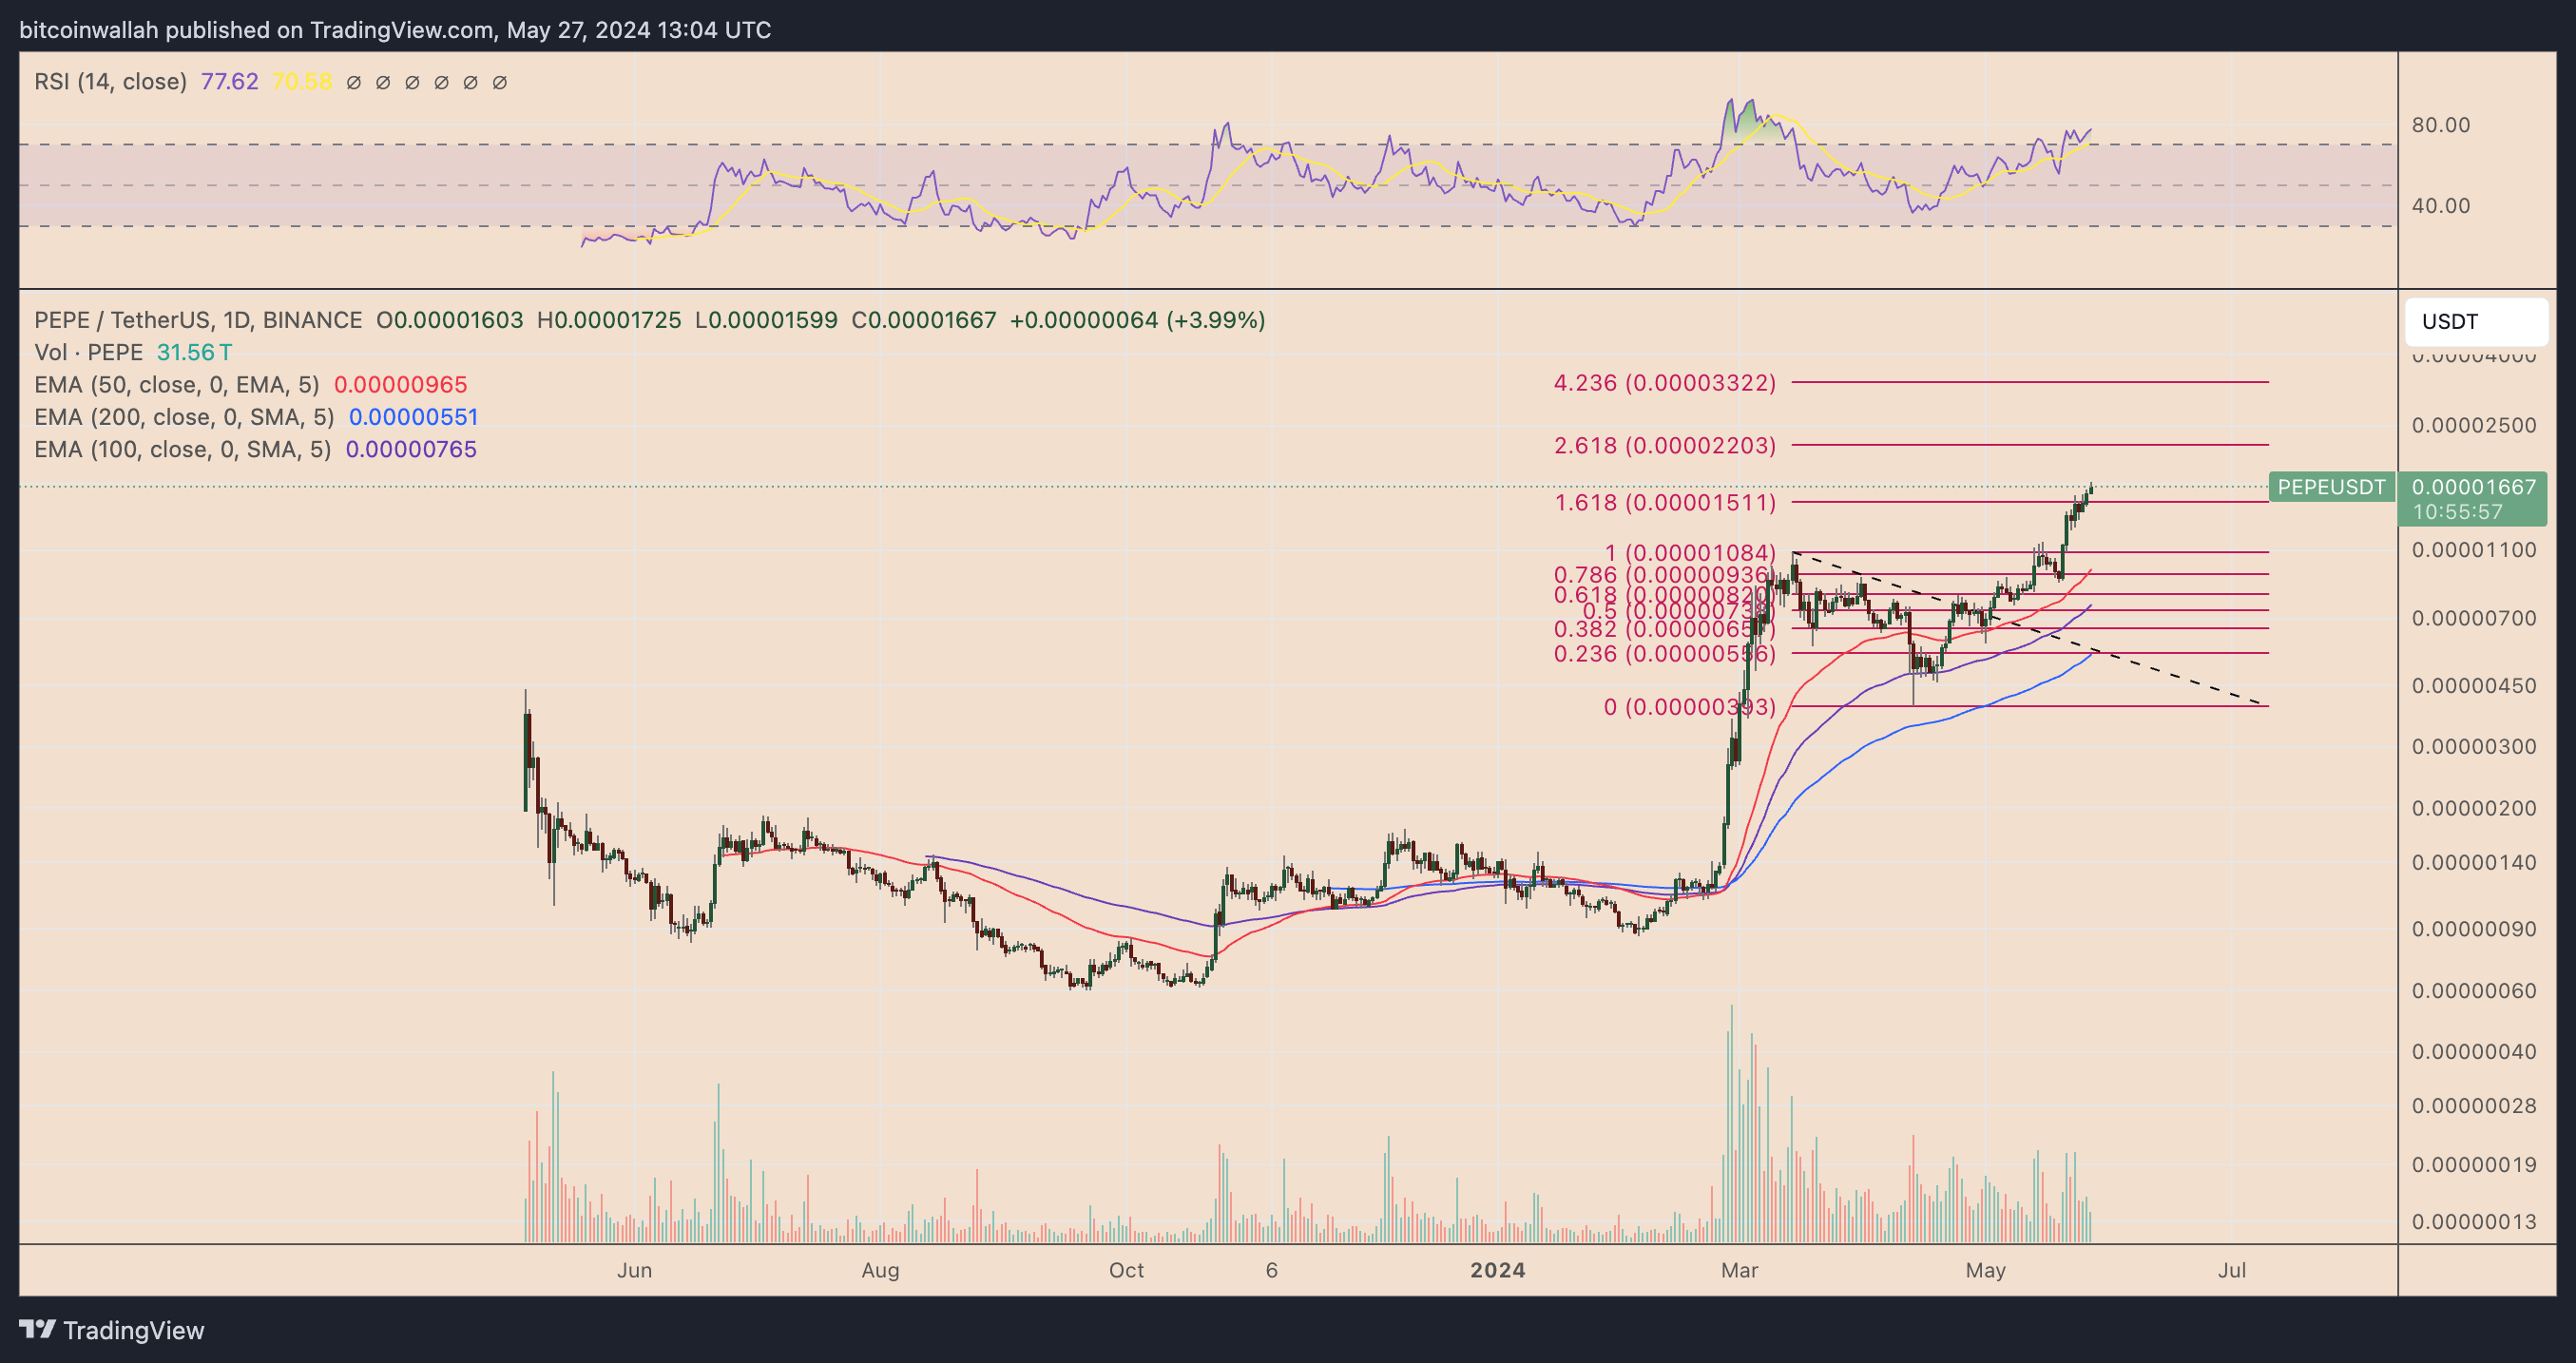
Nonetheless, there have been individual cases wherein traders have withdrawn millions of dollars worth of PEPE tokens from exchanges after the latest pump, reflecting their intention to hold the memecoin instead of selling it at its current highs.
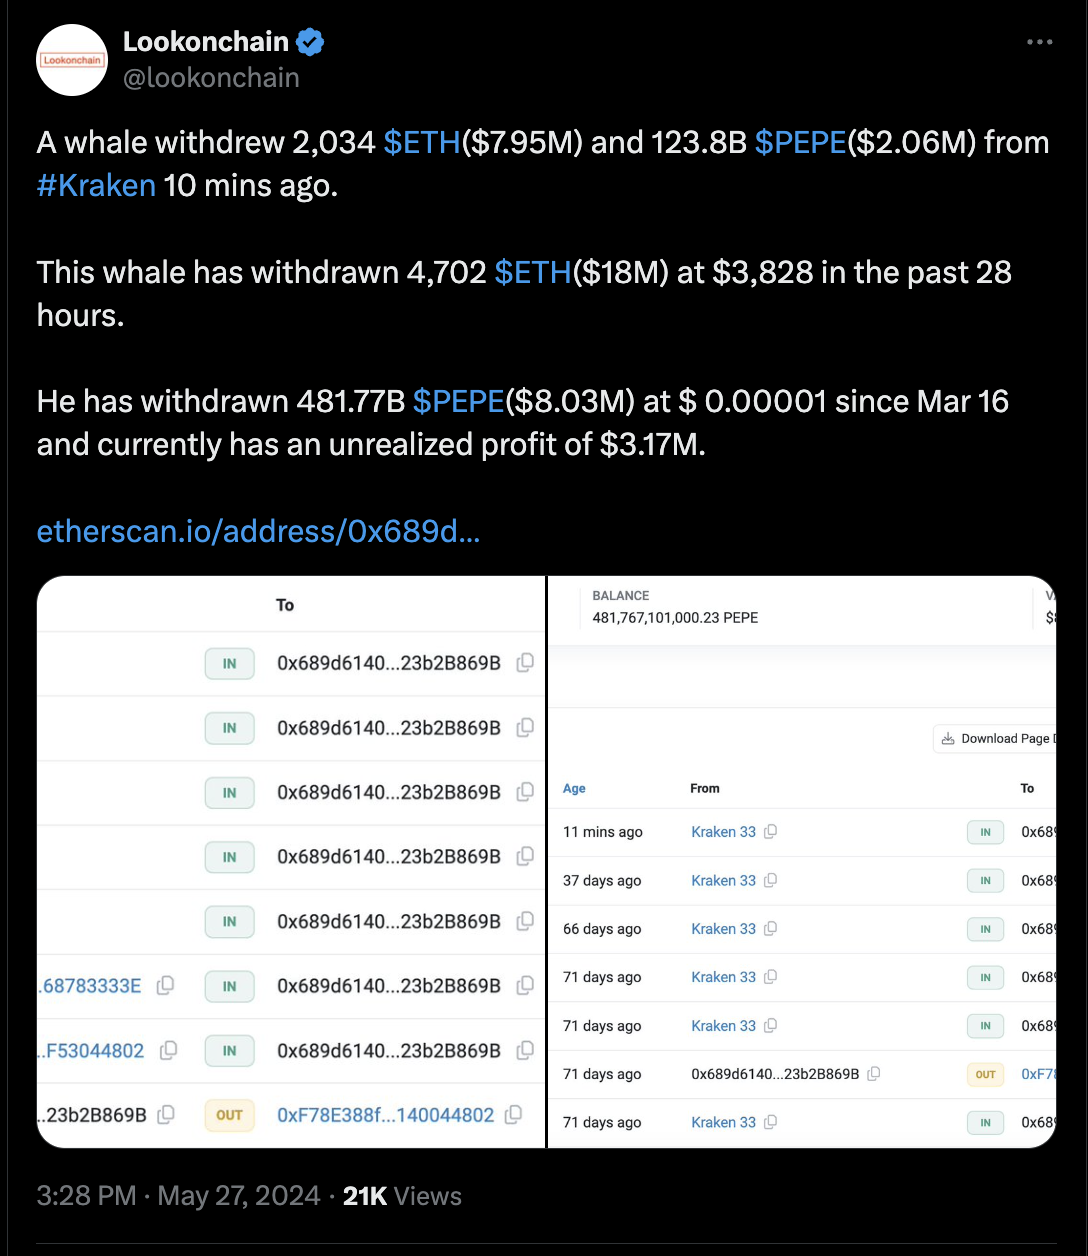
The impact of these withdrawals on the overall whale supply data is yet to be seen, however, which furthers PEPE’s correction risks in June.
This article does not contain investment advice or recommendations. Every investment and trading move involves risk, and readers should conduct their own research when making a decision.


Responses