New Bitcoin whales, ETFs are up only 1.6% in unrealized profit — Is the BTC bottom in?

The Bitcoin bottom may be in ahead of the halving, based on the profitability levels of large BTC holders and technical chart patterns.

Institutional investors and Bitcoin exchange-traded fund (ETF) holders are barely up in unrealized profits, suggesting that this cohort is likely not to produce much selling pressure in the short term. So was the dip below $60,000 the local bottom for Bitcoin (BTC) price?
Bitcoin ETF holders only up 1.6% in unrealized profit
Short-term Bitcoin whales, or investors holding at least 1,000 BTC for up to 155 days have an unrealized profit of just 1.6% on their holdings, according to CryptoQuant data.
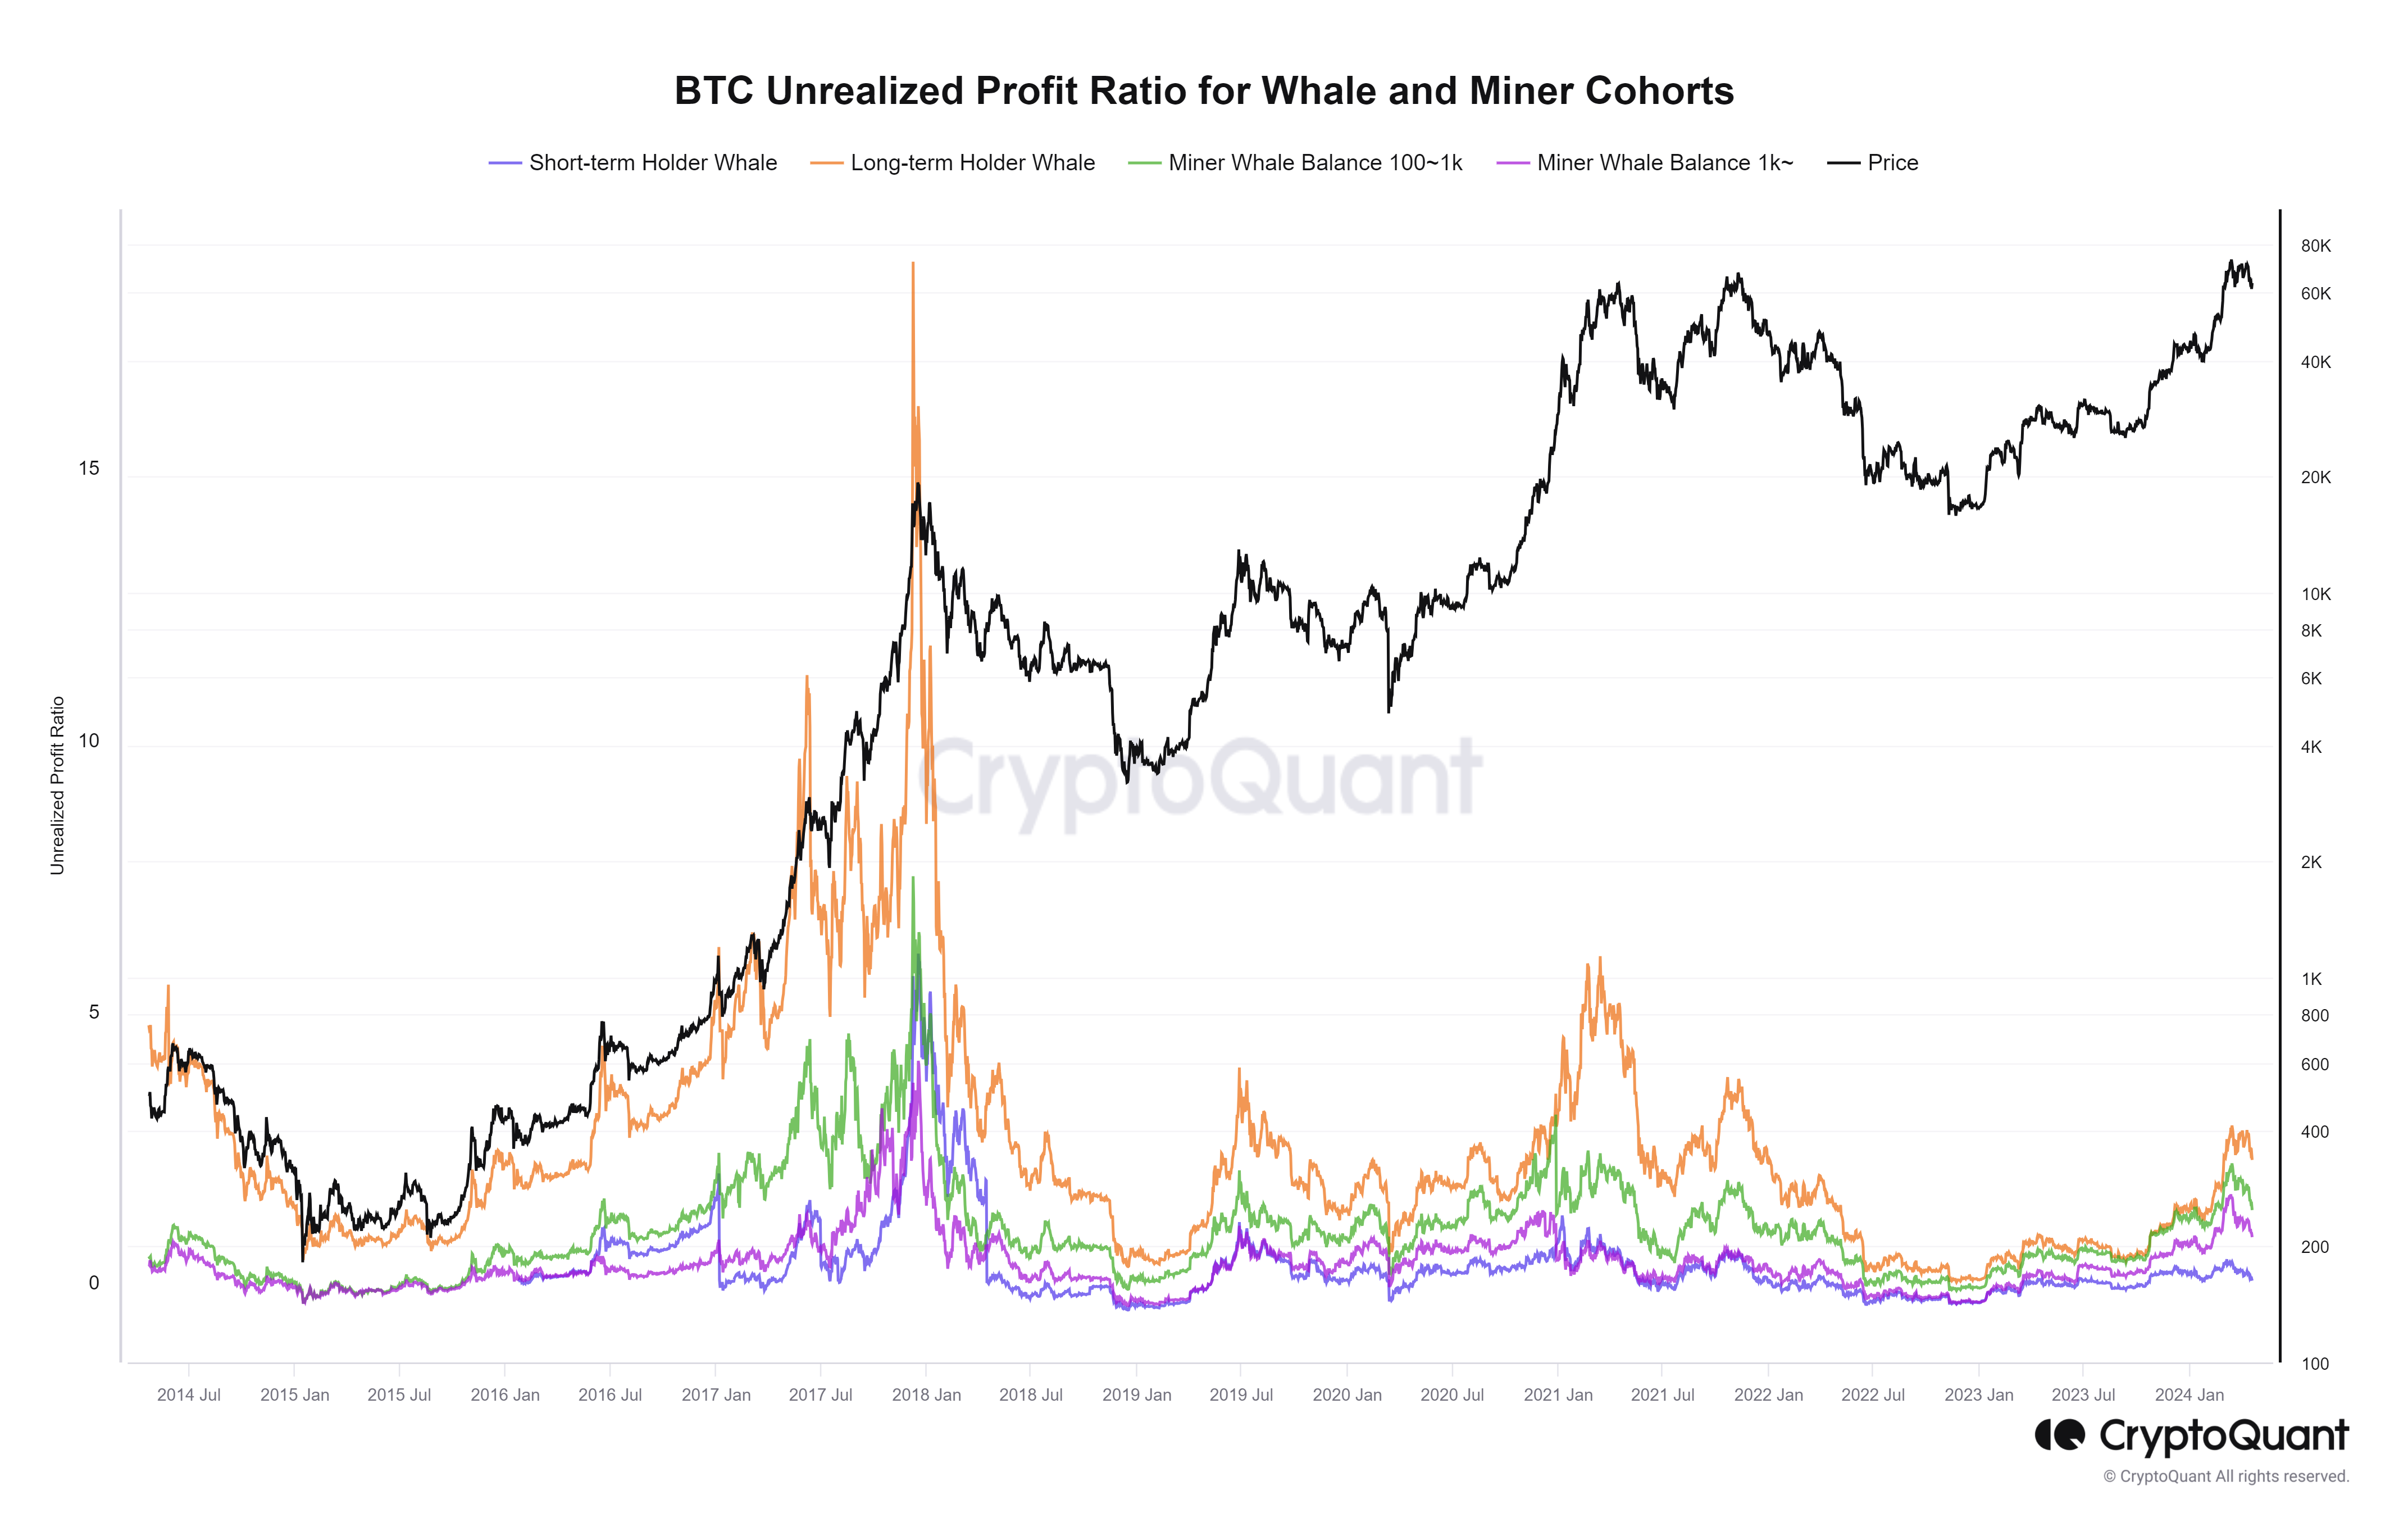
In contrast, the cohort of old whales holding at least 1,000 BTC for over 155 days has a 223% unrealized profit, according to Ki Young Ju, founder and CEO of CryptoQuant. Ju wrote in an April 19 X post:
“Not enough profit to end this cycle, [in my opinion].”
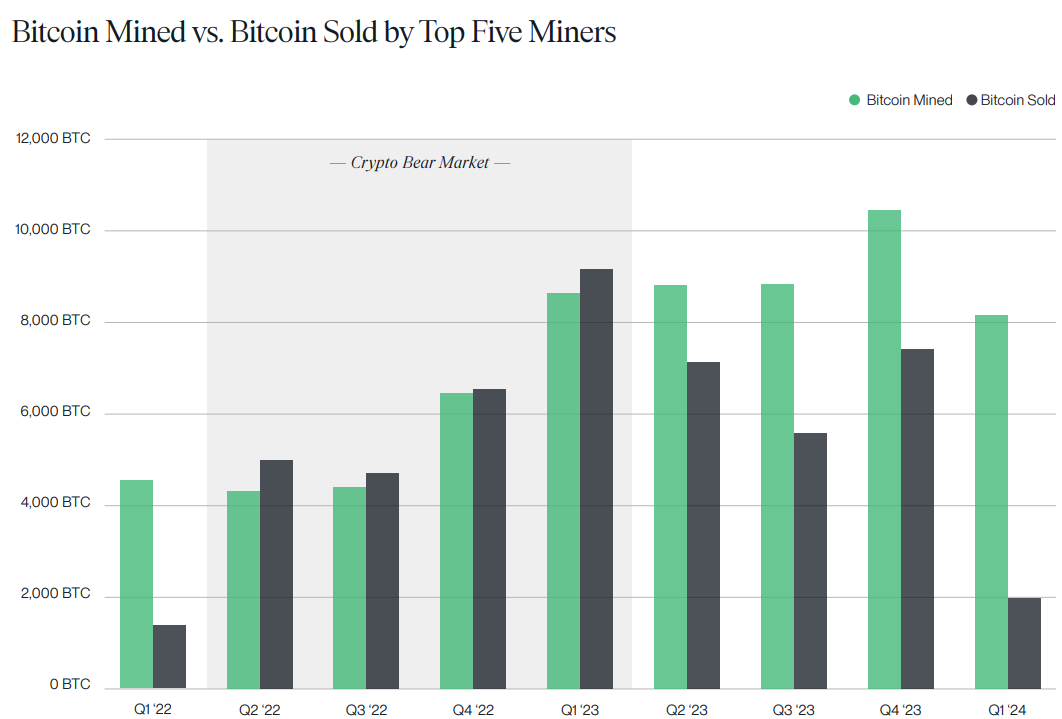
Unrealized profits for small miners are at 131%, while the cohort of big mining firms are up 81%. Despite the significant unrealized profit, the five largest mining firms have not been selling in anticipation of the Bitcoin halving.
Bitcoin selling by the top five mining firms slowed to a two-year low in the first quarter of 2024, when the five largest miners sold a total of approximately 2,000 BTC, according to an April 10 report by Bitwise.
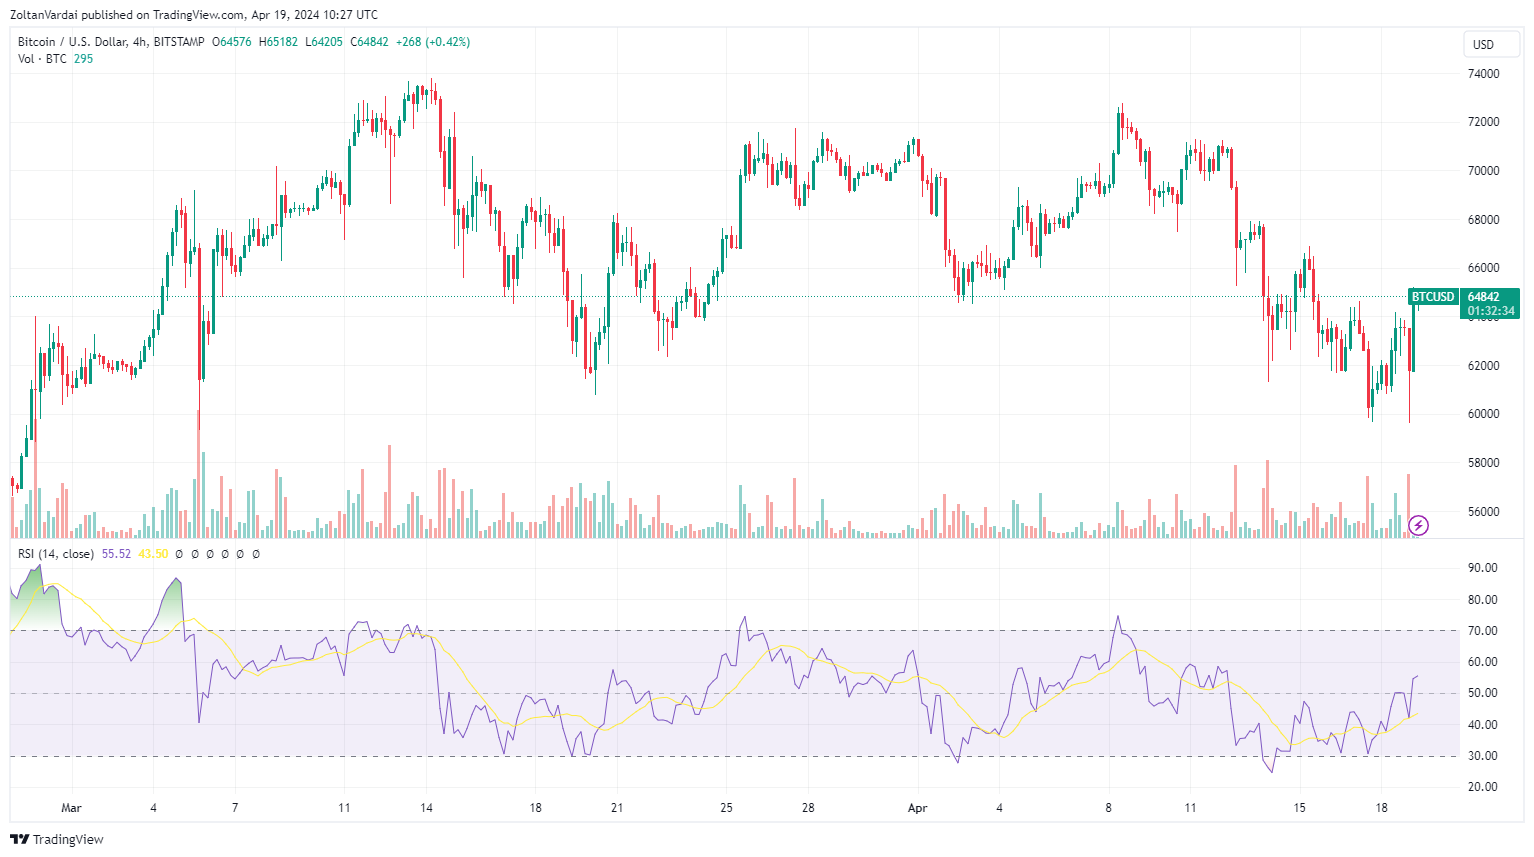
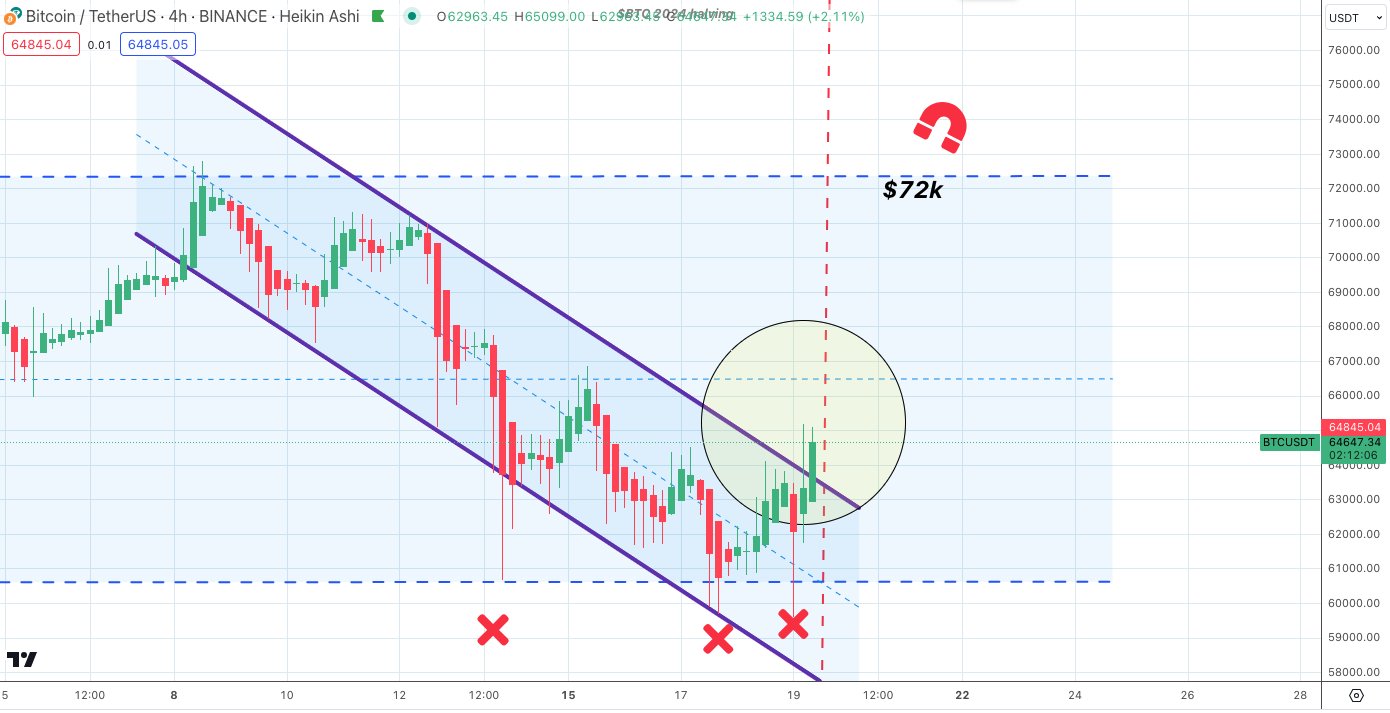
Bitcoin price fell below $60,000 on April 16 and April 19, before bouncing back toward $65,000. So technical analysts are anticipating that the BTC price may have formed a “double bottom” pattern.
Following this week’s dip, key technical indicators have also turned reset from overbought territory. Bitcoin’s relative strength index (RSI) on the daily chart, for example, is 46, which means that the asset’s price is neutral, down from 76 on March 17, when Bitcoin was overbought.
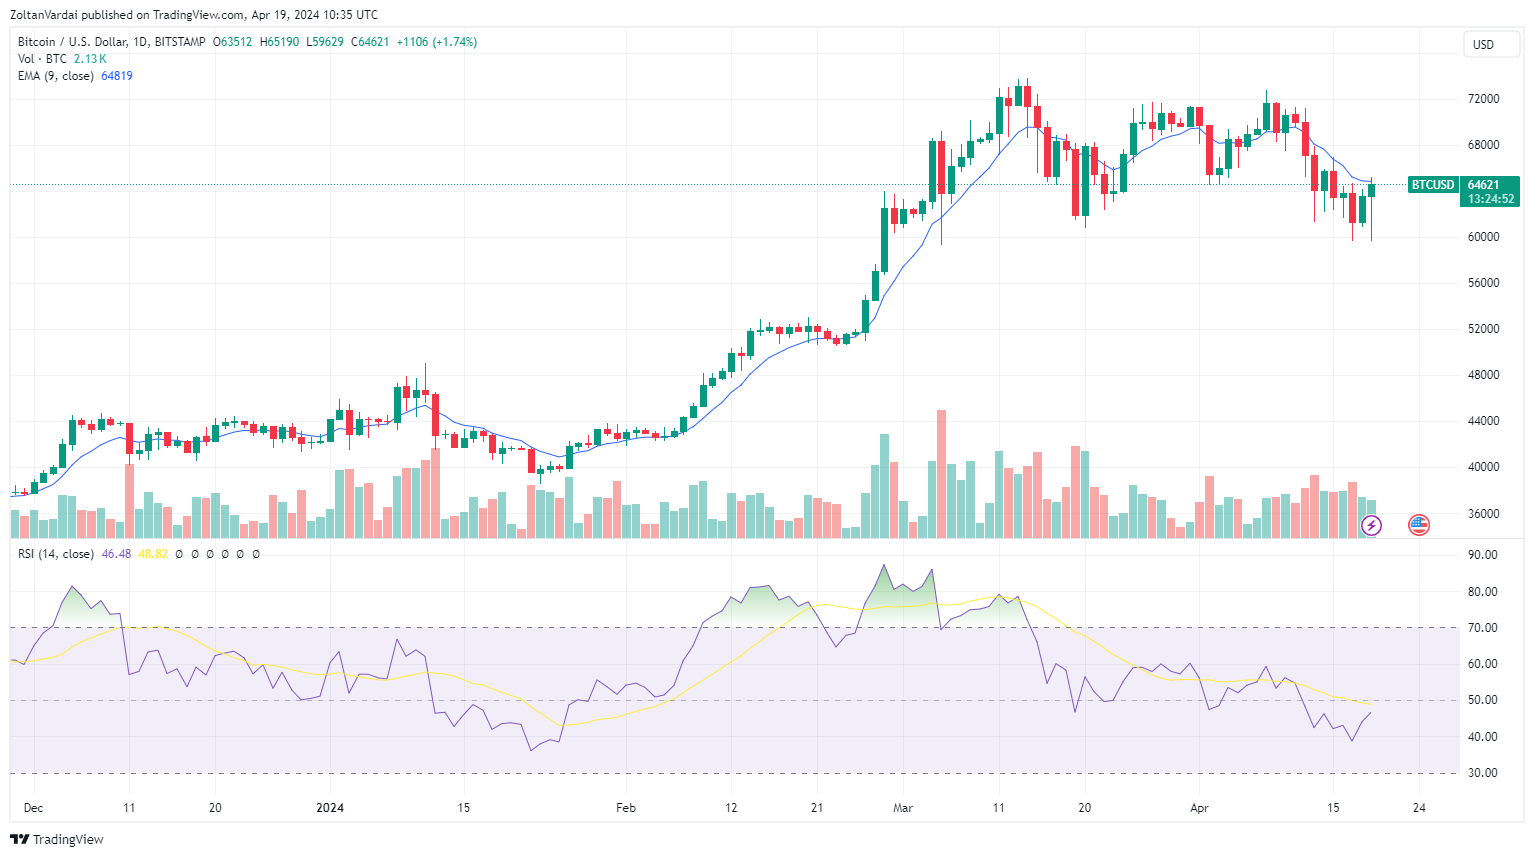
The RSI is a popular momentum indicator used to measure whether an asset is oversold or overbought based on the magnitude of recent price changes.
Related: With 10 days to the halving, analysts predict $150K Bitcoin top
Is the Bitcoin bottom in?
Bitcoin’s retrace to below $60,000 earlier this week may have marked the local bottom for the market, argues Arthur Cheong, founder and CIO of DeFiance Capital. Cheong wrote in an April 19 X post:
“Very high chance that was the local bottom.”
Additionally, Bitcoin price broke out from a significant channel on the 4-hour chart. This suggests that $72,000 could be up next, according to popular crypto trader Satoshi Flipper’s April 19 X post.
Institutional net inflows from the ten U.S. spot Bitcoin ETFs have turned negative on the week of the halving. The Bitcoin ETFs saw over $147 million worth of cumulative net outflows on April 18, according to Dune.

The slowing ETF inflows were the main reason behind Bitcoin’s downward price action, which is set to turn bullish with the upcoming halving, according to Denis Petrovcic, CEO and founder of Blocksquare. He told Cointelegraph:
“While some might anticipate a drop post-halving, the sustained institutional interest and decreased block rewards should keep BTC prices stable or slightly bullish, avoiding the typical ‘sell the news’ fallout.”
Related: BRC-20 tokens bleed ahead of Bitcoin halving as trader focus shifts to Runes
This article does not contain investment advice or recommendations. Every investment and trading move involves risk, and readers should conduct their own research when making a decision.


Responses