Bitcoin Bollinger Band suggests further Bitcoin downside, but bull market still on: Traders

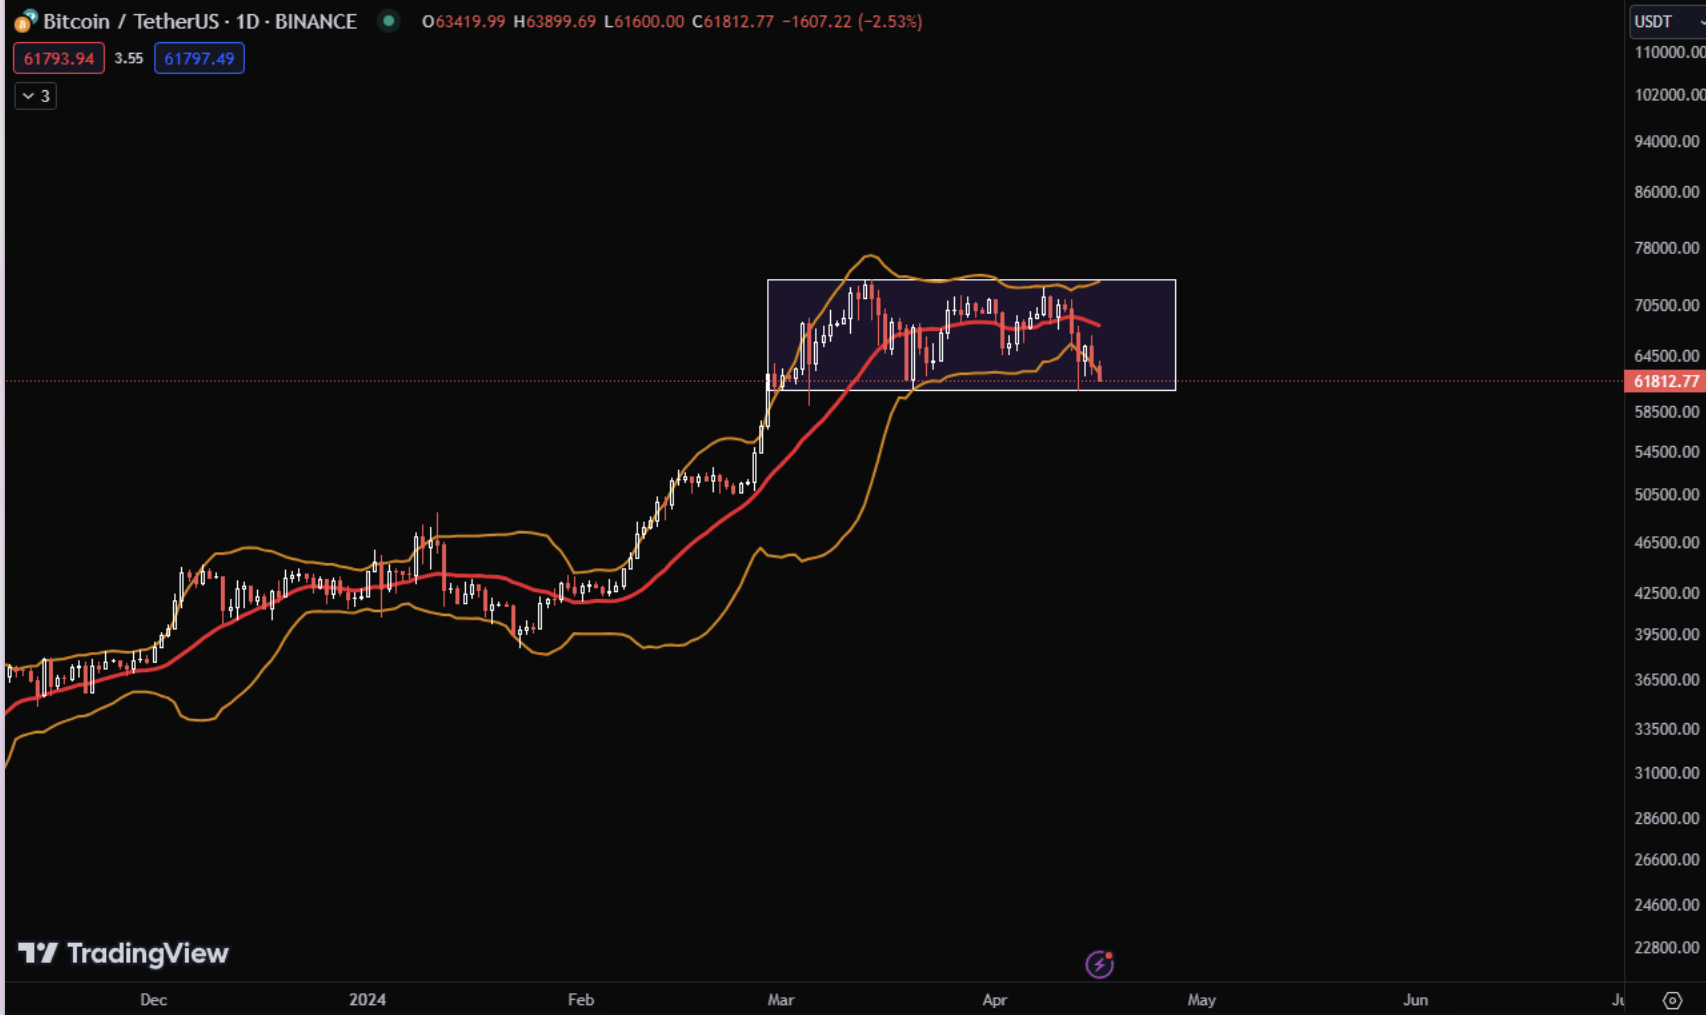
Crypto traders are pointing to Bitcoin’s bollinger band being "released slowly" as an indicator that its price could see some downward movement in the short-term.

The price of Bitcoin (BTC) could see further downside in the near-term future without shutting down bull market momentum, according to traders using a widely used momentum indicator.
Bollinger Bands are a technical analysis tool that uses price volatility to indicate potential entry and exit opportunities in trading. Traders essentially aim to buy near the lower band and sell near the upper band.
Traders forecasted that the increased daily volatility in the price range indicates that Bitcoin is positioned for further downward movement.
“Bollinger Band squeeze being released slowly, only thing you need is close below the support and you will see expansion to 50Ks,” pseudonymous crypto trader Aqua told his 16,500 X followers in an April 17 post.

In a series of X posts on April 17, Stockmoney Lizards predicted a “continued correction” despite the imminent Bitcoin halving on April 20. However, it reassured that the market maintains long-term bullish momentum.
“No the bull market is not over. Just taking a break. Which is ok after such a 1-year up-only move,” it wrote.
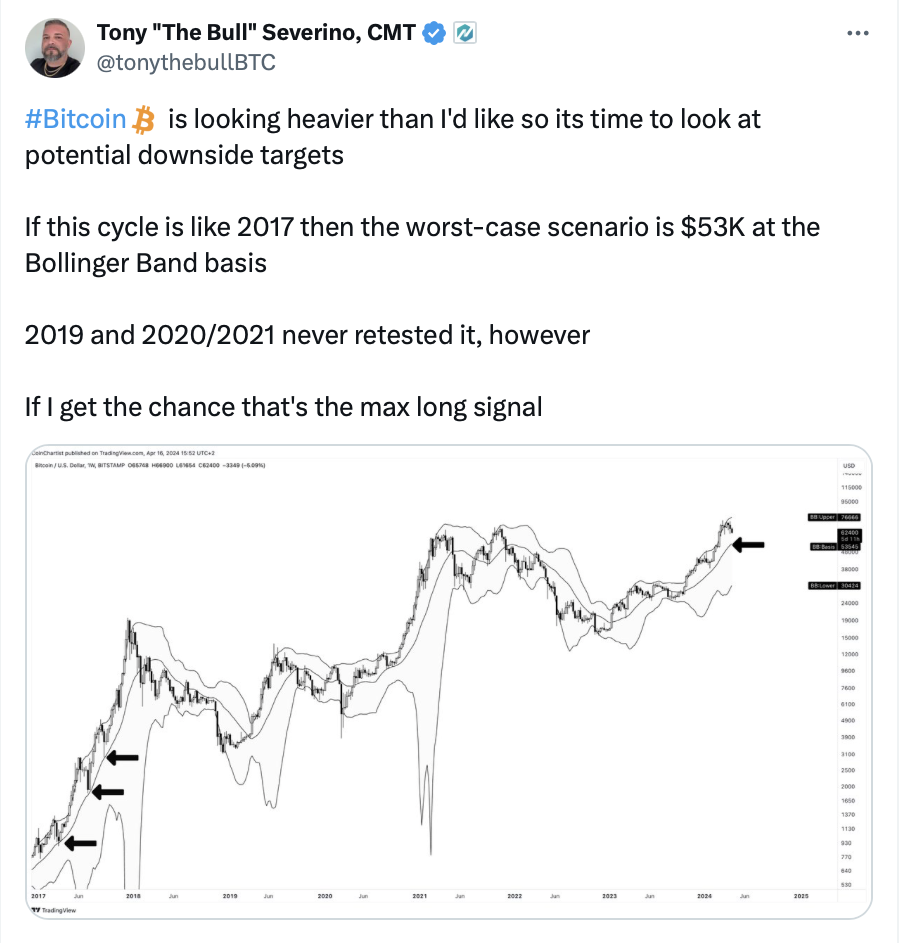
Meanwhile, technical analyst Tony Severino suggests that Bitcoin’s price may experience significant volatility if the market cycle resembles that of 2017.
“If this cycle is like 2017 then the worst-case scenario is $53K at the Bollinger Band basis,” he stated in an April 16 post on X.

On the same day, pseudonymous crypto trader Rekt Capital declared in a post on X that Bitcoin needs to maintain its current support levels “to avoid breaking down and equalling the lows of the March 2023 18% pullback.”
Related: Bitcoin price falls under $62K amid wavering spot BTC ETF demand
Trading resource Material Indicators explained that the buy-side support is forming strongly at approximately 5% below Bitcoin’s current price of $64,242.
“Fire Charts shows bid liquidity based support is building in the $59k-$61k range with secondary support laddered down to $50k,” it wrote.
If Bitcoin’s price goes right down to the lower end of that range at $59,000, approximately $2.2 billion of long positions will be liquidated, as per CoinGlass data.
Furthermore, Bitcoin’s price has minimal wiggle room before a significant amount of short positions are wiped out. If Bitcoin’s price rises just 1.15% from its current price to $65,000, $551 million in short positions will be liquidated.


Responses