Bitcoin bulls chase after $50K, opening the door for IMX, KAS, TIA an STX to rally higher
Bitcoin’s strength has improved crypto sentiment, pulling altcoins like IMX, KAS, TIA and STX higher.

Risky assets have been on a roll for several days. The S&P 500 Index has notched five successive weeks of gains, and Bitcoin (BTC) also rose more than 13% this week, indicating aggressive buying by the bulls.
BitMEX Research data shows $2.7 billion in inflows into the nine Bitcoin exchange-traded funds (ETFs) on Feb. 9, while outflows from Grayscale Bitcoin Trust (GBTC) reduced to $51.8 million. The total assets under management of the ETFs have soared to $10 billion.

Bitcoin’s sharp rise has boosted positive sentiment, but Material Indicators’ CEO and co-founder Keith Alan cautioned in a X (formerly Twitter) post that Bitcoin is likely to face stiff resistance between the current level and $50,000.
While Bitcoin continues to garner all the limelight, select altcoins have started to make their move. Let’s look at the charts of the top 5 cryptocurrencies that may outperform in the near term.
Bitcoin price analysis
Bitcoin’s rally has reached the stiff overhead resistance at $48,970, which is likely to witness a tough battle between the bulls and the bears.

The upsloping 20-day exponential moving average ($44,164) and the relative strength index (RSI) in the overbought zone indicate that the path of least resistance is to the upside. If bulls drive the price above $48,970, the BTC/USDT pair may accelerate toward $52,000. If this level is surmounted, the rally could reach $60,000.
Conversely, if the price turns down sharply from the current level, it will indicate a possible consolidation between $44,700 and $48,970 for a few days. The short-term trend will weaken on a break below the 20-day EMA.

The sharp up move pushed the RSI into the overbought zone on the 4-hour chart, indicating that a correction is possible in the near term. The bears will have to drag the price below the 20-EMA to signal the start of a deeper pullback toward the 50-simple moving average.
On the contrary, if the price turns up from the current level or rebounds off the 20-EMA, it will suggest aggressive buying on dips. The pair may then break out of $48,970 and dash toward the next major resistance at $52,000.
Immutable price analysis
Immutable (IMX) broke above the $2.60 resistance on Feb. 10, indicating the resumption of the uptrend.

However, the bears are unlikely to give up easily. They will try to pose a strong challenge at the $2.85 level. If the price turns down and breaks below $2.60, it will indicate that the bullish momentum is weakening. The IMX/USDT pair may then drop to the 20-day EMA ($2.24). The bears will have to sink the price below the moving averages to signal a comeback.
Alternatively, if the bulls do not cede ground to the bears, it will suggest that they are holding on to their positions in anticipation of a breakout. If the $2.85 resistance is surpassed, the pair could climb to $3 and thereafter to $3.50.

The price turned down from $2.85, indicating that short-term traders are booking profits near the resistance. The immediate support is at the 20-EMA. If the price rebounds off the 20-EMA, it will suggest that the sentiment remains bullish and traders are viewing the dips as a buying opportunity.
A break and close above $2.85 will indicate that the bulls have asserted their supremacy. The pair may then rise to $3. This optimistic view will be invalidated in the short term if the price plummets below the 20-EMA. That may start a drop to the 50-SMA.
Kaspa price analysis
The bulls successfully defended the psychological support of $0.10 during the correction in Kaspa (KAS), indicating buying at lower levels.

The KAS/USDT pair picked up momentum after breaking above the moving averages on Feb. 7 and reached the stiff overhead resistance near $0.15. Sellers will try to halt the up move at this level.
The first support on the downside is $0.13. If this level holds, the possibility of a break above $0.15 increases. The bulls will then try to resume the uptrend. There is a minor resistance at $0.16, but if this level is scaled, the pair may reach $0.20.
On the other hand, a break and close below $0.13 may keep the pair range-bound between $0.10 and $0.15 for a while.

The 4-hour chart shows that the pair is in a strong uptrend. The 20-EMA is the crucial support to keep an eye on. If the price turns up from the current level or rebounds off the 20-EMA, it will indicate that the bulls remain buyers on pullbacks. A break and close above $0.15 will mark the start of the next leg of the uptrend.
If bears want to prevent the upside, they will have to tug the price below the $0.13 support. If they do that, the selling may pick up, and the pair could slump to the 50-SMA and later to $0.10.
Related: Why is Ether (ETH) price up today?
Celestia price analysis
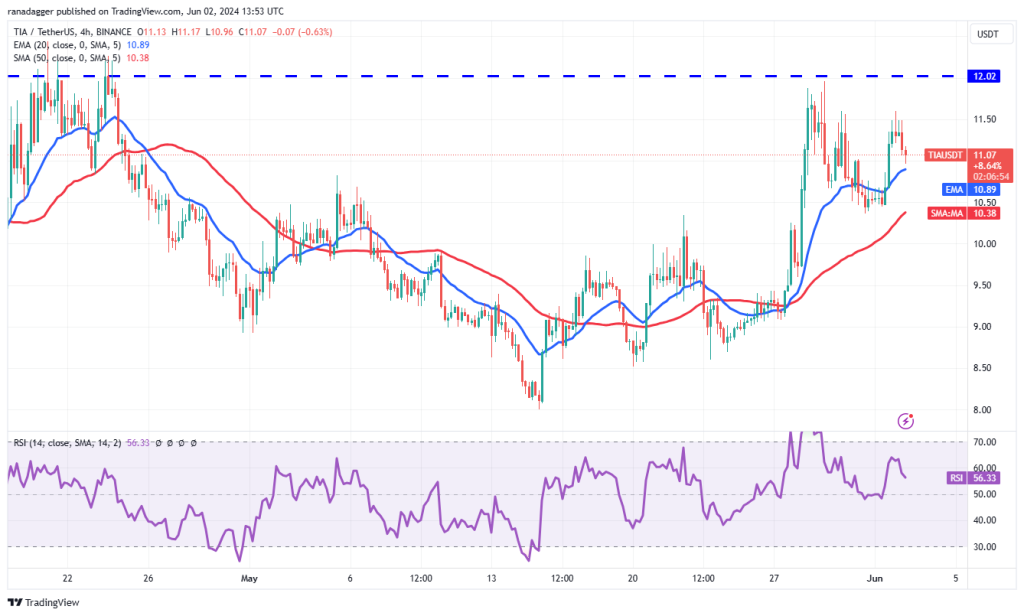
Celestia (TIA) has been in an uptrend for several days, but the bulls are facing stiff resistance at the $20.40 level.

The upsloping moving averages and the RSI in the positive territory indicate that the buyers remain in control. If the bulls do not give up much ground from the current level, it will enhance the prospects of a rally above $20.40. If that happens, the TIA/USDT pair could travel toward its next target objective of $25.
Contrarily, if the price turns down from the current level and breaks below the 20-day EMA ($18.01), it will indicate that the bulls are rushing to the exit. The short-term trend will tilt in favor of the bears on a break below the 50-day SMA ($16.16).

The pair’s failure to maintain above the overhead resistance of $20.40 may have attracted profit booking. That has pulled the price below the 20-EMA, indicating the start of a pullback to the uptrend line.
If the price rebounds off the uptrend line, the bulls will again try to overcome the obstacle at $20.40. If they succeed, the pair may jump to $21.14 and start the next leg of the upward move to $25.
On the contrary, a break below the uptrend line will indicate that the bears have seized control in the near term. The pair may fall to $15.60.
Stacks price analysis
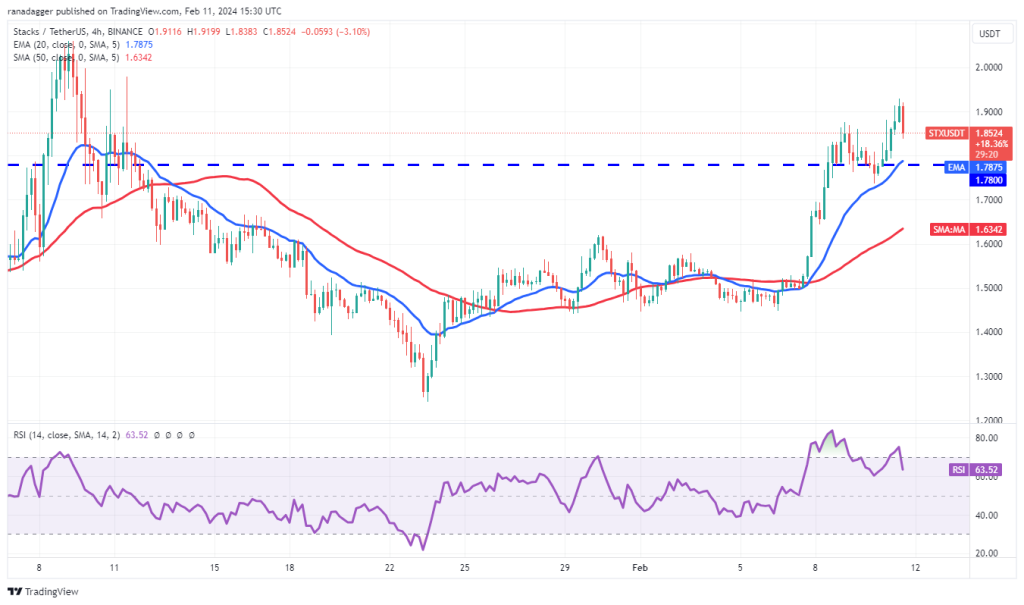
Stacks (STX) has risen above the $1.78 resistance after a brief correction, indicating solid demand at lower levels.

The 20-day EMA ($1.62) has started to turn up, and the RSI has jumped near the overbought zone, indicating that the bulls are in command. The STX/USDT pair could reach the overhead resistance at $2.06, which is likely to act as a formidable hurdle. If buyers overcome it, the pair may surge to $3.
The 20-day EMA is the important support to watch out for on the downside. The bulls are expected to vigorously defend this level, but if the bears prevail, the pair may slump to $1.45.

The bulls are buying the dips to the 20-EMA, but they are likely to face stiff resistance from the bears in the $2 to 2.06 zone. If the price turns down from the overhead zone but takes support at the 20-EMA, it will increase the likelihood of a breakout above the resistance. The pair may then resume its uptrend.
The first sign of weakness will be a break and close below the 20-EMA. It will indicate that the bulls are losing their grip. The pair may then skid to the 50-SMA.


… [Trackback]
[…] Read More on that Topic: x.superex.com/academys/markets/4324/ […]
… [Trackback]
[…] Find More on that Topic: x.superex.com/academys/markets/4324/ […]
… [Trackback]
[…] Find More Info here to that Topic: x.superex.com/academys/markets/4324/ […]
… [Trackback]
[…] Read More Info here on that Topic: x.superex.com/academys/markets/4324/ […]
… [Trackback]
[…] Read More Info here to that Topic: x.superex.com/academys/markets/4324/ […]
… [Trackback]
[…] Find More to that Topic: x.superex.com/academys/markets/4324/ […]
… [Trackback]
[…] Here you will find 44899 more Information on that Topic: x.superex.com/academys/markets/4324/ […]
… [Trackback]
[…] There you can find 57461 more Info to that Topic: x.superex.com/academys/markets/4324/ […]
… [Trackback]
[…] Read More Information here on that Topic: x.superex.com/academys/markets/4324/ […]
… [Trackback]
[…] Read More to that Topic: x.superex.com/academys/markets/4324/ […]
… [Trackback]
[…] Find More Info here to that Topic: x.superex.com/academys/markets/4324/ […]
… [Trackback]
[…] Info on that Topic: x.superex.com/academys/markets/4324/ […]
… [Trackback]
[…] Read More here to that Topic: x.superex.com/academys/markets/4324/ […]
… [Trackback]
[…] Here you can find 72588 additional Info to that Topic: x.superex.com/academys/markets/4324/ […]
… [Trackback]
[…] Read More on that Topic: x.superex.com/academys/markets/4324/ […]
… [Trackback]
[…] Read More on on that Topic: x.superex.com/academys/markets/4324/ […]
… [Trackback]
[…] Find More here to that Topic: x.superex.com/academys/markets/4324/ […]
… [Trackback]
[…] Find More here to that Topic: x.superex.com/academys/markets/4324/ […]
… [Trackback]
[…] Find More on that Topic: x.superex.com/academys/markets/4324/ […]
… [Trackback]
[…] There you can find 16810 more Info on that Topic: x.superex.com/academys/markets/4324/ […]
… [Trackback]
[…] Find More to that Topic: x.superex.com/academys/markets/4324/ […]