Bitcoin price passes $46K after S&P 500 reaches historic highs
Bitcoin and stocks should continue to see a solid bid, analysis concludes, as BTC price strength takes bulls ever closer to the top of the range.

Bitcoin (BTC) took aim at January highs on Feb. 9 as bulls beat out overhead resistance.

Analysis sees continued bid for Bitcoin, stocks
Data from Cointelegraph Markets Pro and TradingView captured a fresh BTC price uptick to $46,365 on Bitstamp.
Up over 2% since the daily close, BTC/USD dealt with increasing sell-side liquidity as it returned to levels not seen since the launch of the United States spot Bitcoin exchange-traded funds (ETFs).
These formed a key argument supporting BTC price upside, with net inflows for nine consecutive days and outflows from the Grayscale Bitcoin Trust (GBTC) staying lower.
Today's #Bitcoin Sent to out by $GBTC/Grayscale comes out to be ~3.7K $BTC or ~$170M worth.
Slight decrease from yesterday.
Yesterday's ETF net flows saw a relatively big +$146M increase.
That makes 9 consecutive positive days of net inflows. https://t.co/dFhcIm6odP pic.twitter.com/5ygX3s8avN
— Daan Crypto Trades (@DaanCrypto) February 8, 2024
Bitcoin’s move also came in tandem with a historic one for U.S. stocks. The S&P 500 hit 5,000 points on the day — the first trip to the significant psychological level ever.
“Since the October 27th low, the S&P 500 is now up ~900 points,” trading resource The Kobeissi Letter wrote in part of a reaction on X (formerly Twitter).
“This means that the S&P 500 has added nearly $8.5 TRILLION in market cap in just over 3 months. Truly a historic run for stocks.”

In its latest market update on Feb. 8, trading firm QCP Capital suggested that the uptrend on both stocks and crypto could well continue to play out.
“It is likely that any dip in equities will continue to be bought as underallocated investors chase returns,” it reasoned.
“On the back of this bullish sentiment, BTC and ETH are likely to follow, coupled with the BTC halving and ETH spot ETF narratives.”
BTC price range top on horizon
Looking to the immediate future, Keith Alan, co-founder of trading platform Material Indicators, noted the need to avoid wicks below the 50-day simple moving average, currently at just over $43,000.
Related: Bitcoin futures data hints at BTC price rally extending beyond $45K
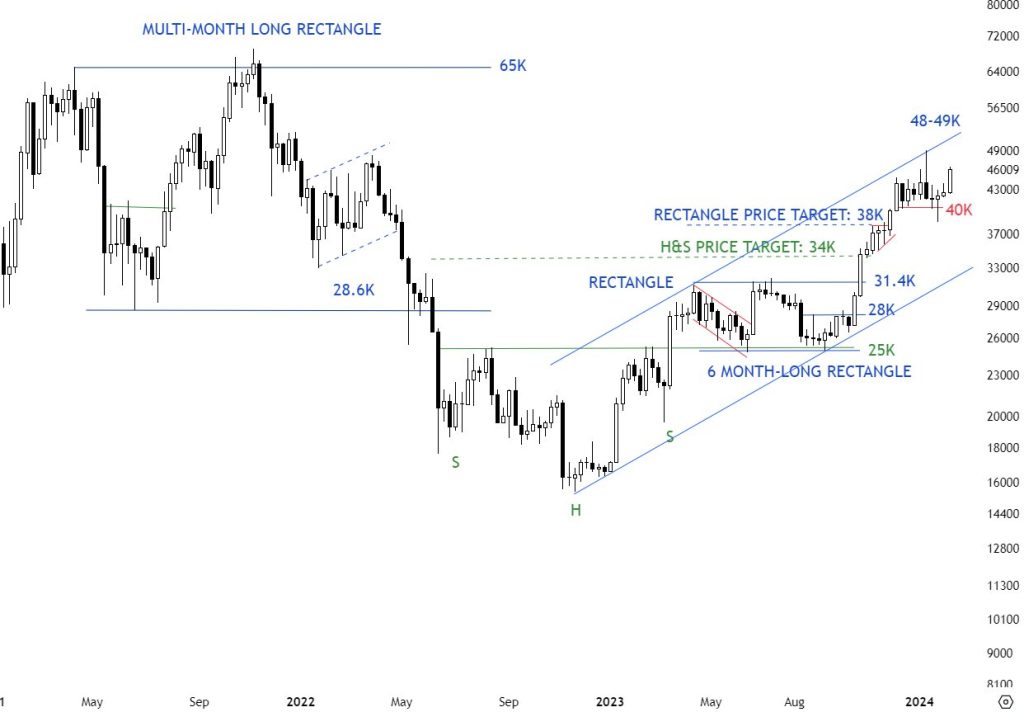
“BTCUSD 40K horizontal support held on a weekly closing basis,” popular trader Aksel Kibar wrote in his own analysis of higher timeframes.
“Trend channel is intact. Upper boundary acts as resistance around 48-49K.”

Kibar touched on the still-persisting BTC price range now in place for more than 150 days, with January’s post-ETF highs as its ceiling.
As Cointelegraph reported, various theories have recently emerged as to how this may fall into April’s block subsidy halving.
This article does not contain investment advice or recommendations. Every investment and trading move involves risk, and readers should conduct their own research when making a decision.

… [Trackback]
[…] Information to that Topic: x.superex.com/academys/markets/4278/ […]
… [Trackback]
[…] Find More Information here to that Topic: x.superex.com/academys/markets/4278/ […]
… [Trackback]
[…] Find More Info here on that Topic: x.superex.com/academys/markets/4278/ […]
… [Trackback]
[…] Information on that Topic: x.superex.com/academys/markets/4278/ […]
… [Trackback]
[…] Info on that Topic: x.superex.com/academys/markets/4278/ […]
… [Trackback]
[…] Read More Info here to that Topic: x.superex.com/academys/markets/4278/ […]
… [Trackback]
[…] Find More here on that Topic: x.superex.com/academys/markets/4278/ […]
… [Trackback]
[…] Read More Information here on that Topic: x.superex.com/academys/markets/4278/ […]
… [Trackback]
[…] Read More here on that Topic: x.superex.com/academys/markets/4278/ […]
… [Trackback]
[…] Info on that Topic: x.superex.com/academys/markets/4278/ […]
… [Trackback]
[…] Info to that Topic: x.superex.com/academys/markets/4278/ […]
… [Trackback]
[…] Read More here to that Topic: x.superex.com/academys/markets/4278/ […]
… [Trackback]
[…] Here you can find 23339 additional Info to that Topic: x.superex.com/academys/markets/4278/ […]
… [Trackback]
[…] Find More Info here to that Topic: x.superex.com/academys/markets/4278/ […]
… [Trackback]
[…] Find More here on that Topic: x.superex.com/academys/markets/4278/ […]