Why is Bitcoin price stuck?

Bitcoin’s price is stuck in a range, balancing optimism from increased institutional investments against concerns over potential sell-offs by miners.

Bitcoin (BTC) price is stuck inside a range, reflecting uncertainty and indecision among market participants after spot Bitcoin ETF were approved last week.
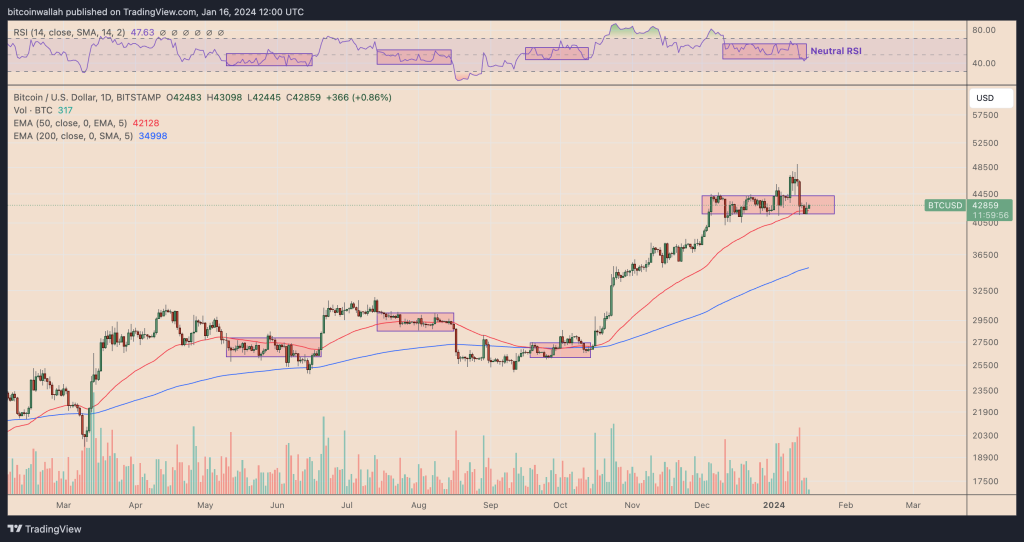
As of Jan. 16, BTC’s price has been confined between $41,550 and $43,000. This stagnation persists despite a previous attempt at a breakout earlier in the month, during which the cryptocurrency briefly surged to a high of over $49,000, only to fall back into its current range.

The flatness in Bitcoin’s price can be attributed to several factors discussed below.
Muted response to Bitcoin ETF approval
Bitcoin’s run-up to over $49,000 appeared in the wake of eleven spot BTC ETF approvals, including those of BlackRock and Fidelity, in the United States. Nonetheless, the price retreated around 10% since — a scenario that some analysts had anticipated.
#Bitcoin – We got the "Told you it wasn't a sell the news event" tweets. Now we got the giant red candle and the "Told you it was a sell the news". Next stop, Twitter telling you to buy the dip even though somehow everyone was already all in. https://t.co/ZJRRb6pG38
— IncomeSharks (@IncomeSharks) January 12, 2024
This suggests that the approval was largely priced in by the market. There wasn’t a significant rally post the ETF approval, indicating that investors had adjusted their expectations accordingly.
Bitcoin dominance slides
Bitcoin’s market dominance index has dropped from its local top of 54.56% to 51.14% in a week.

Gains by Ether (ETH) is the major reason why Bitcoin’s dominance declined, comprising 8.5% with other altcoins posting similar gains.
This suggests that traders likely rotated capital out of Bitcoin to the altcoin market following the ETF approvals, seeing better risk-reward elsewhere, particularly with an Ethereum ETF now on the table.
Related: Spot Ethereum ETFs now have a straight shot for approval — Analysts
Mixed fundamental outlook
One significant positive market indicator for Bitcoin is the increasing capital inflow into BTC investment funds, particularly amidst the growing excitement around spot Bitcoin ETFs.
These Bitcoin funds attracted $1.25 billion from institutional investors in the first two weeks of 2024, or almost 55% of the entire previous year. This influx highlights the strong confidence of institutional players in Bitcoin’s long-term value and potential.

Offsetting this bullish fundamental, however, are miners.
There is a growing concern that the increased hash rate in Bitcoin mining could lead miners to sell their coins faster. Some anticipate that the cost of Bitcoin mining will jump after the halving in April 2024, potentially putting pressure on BTC price
As of late, Bitcoin miners have collectively transferred more than $1 billion worth of Bitcoin to crypto exchanges.
Koreans buying, Americans selling
The current period of Bitcoin’s sideways price behavior is occurring alongside a noticeable trend of increasing buying in South Korea to offset selling in the U.S.
Related: Bitcoin faces ‘very limited liquidity’ as BTC price pushed below $43K
The Kimchi Premium Index, a metric measuring the difference in Bitcoin prices between South Korean and global cryptocurrency exchanges, indicates that Bitcoin is trading at a 3-4% premium in South Korea.

Concurrently, the Coinbase Premium Index, which compares the price of Bitcoin in USD on Coinbase Pro with its USDT price on Binance, has shifted into negative territory, suggesting more U.S. sellers than buyers.
Neutral RSI
From a technical perspective, Bitcoin’s rangebound price movements coincide with its daily relative strength index’s (RSI) return to its neutral zone.
These two conditions, when observed together, typically suggests that the market sentiment is reaching an equilibrium, wherein neither bulls (buyers) nor bears (sellers) are in control.

Investors may wait for more information before making significant moves, resulting in lower volatility and less directional movement in prices.
This article does not contain investment advice or recommendations. Every investment and trading move involves risk, and readers should conduct their own research when making a decision.


… [Trackback]
[…] Find More here on that Topic: x.superex.com/academys/markets/2711/ […]
… [Trackback]
[…] Read More on to that Topic: x.superex.com/academys/markets/2711/ […]
… [Trackback]
[…] Info on that Topic: x.superex.com/academys/markets/2711/ […]
… [Trackback]
[…] There you can find 98449 additional Info on that Topic: x.superex.com/academys/markets/2711/ […]
… [Trackback]
[…] Find More on that Topic: x.superex.com/academys/markets/2711/ […]
… [Trackback]
[…] Read More here on that Topic: x.superex.com/academys/markets/2711/ […]
… [Trackback]
[…] Read More Information here to that Topic: x.superex.com/academys/markets/2711/ […]
… [Trackback]
[…] Read More on on that Topic: x.superex.com/academys/markets/2711/ […]
… [Trackback]
[…] Info to that Topic: x.superex.com/academys/markets/2711/ […]
… [Trackback]
[…] Information on that Topic: x.superex.com/academys/markets/2711/ […]
… [Trackback]
[…] Find More Info here to that Topic: x.superex.com/academys/markets/2711/ […]
… [Trackback]
[…] Read More Info here to that Topic: x.superex.com/academys/markets/2711/ […]
… [Trackback]
[…] Read More Information here on that Topic: x.superex.com/academys/markets/2711/ […]
… [Trackback]
[…] Find More Info here on that Topic: x.superex.com/academys/markets/2711/ […]
… [Trackback]
[…] Read More on on that Topic: x.superex.com/academys/markets/2711/ […]
… [Trackback]
[…] Read More Information here on that Topic: x.superex.com/academys/markets/2711/ […]
… [Trackback]
[…] Information to that Topic: x.superex.com/academys/markets/2711/ […]
… [Trackback]
[…] Info to that Topic: x.superex.com/academys/markets/2711/ […]
… [Trackback]
[…] Info on that Topic: x.superex.com/academys/markets/2711/ […]
… [Trackback]
[…] Information to that Topic: x.superex.com/academys/markets/2711/ […]
… [Trackback]
[…] Find More to that Topic: x.superex.com/academys/markets/2711/ […]