ICP, ARB, STX and MKR flash signs as traders anticipate a spot Bitcoin ETF approval

The SEC’s decision on the spot Bitcoin ETF applications could impact altcoins like ICP, ARB, STX and MKR.

Bitcoin (BTC) bulls are likely to remain on the edge of their seats as the spot BTC exchange-traded fund verdict nears. Analysts anticipate the United States Securities and Exchange Commission to take a call on the spot Bitcoin ETF applications between Jan. 8 and Jan. 10.
Will Bitcoin soar if one or more spot Bitcoin ETFs are approved? That is the central question on investor’s minds. Bitcoin’s price is likely to spike after the approval of the ETFs, but after the initial euphoria, traders may start booking profits in a classic case of buy the rumor and sell the news.

If the regulators do not approve the spot Bitcoin ETF, a sharp sell-off is possible. However, it is unlikely to start a bear market as traders will quickly shift focus to Bitcoin halving in April, limiting the downside. In addition, the narrative that the Bitcoin ETFs may eventually be approved could bring the bulls back at lower levels.
If Bitcoin remains positive, select altcoins are likely to resume their uptrends. Let’s look at the charts of the top 5 cryptocurrencies that may outperform in the near term.
Bitcoin price analysis
Bitcoin formed a Doji candlestick pattern on Jan. 5 and an inside-day candlestick pattern on Jan. 6, showing indecision between the bulls and the bears.

However, a positive sign is that the price remains inside the ascending triangle pattern. This bullish setup will complete on a break and close above $44,700. If that happens, the BTC/USDT pair could start the next leg of the uptrend to the pattern target of $49,178 and subsequently to $52,000.
The support line of the triangle is the important level to watch out for on the downside. If this level gives way, the pair may slump to $40,000 and eventually to $37,980. Buyers are likely to guard this level with vigor.

The 20-exponential moving average is flattening out, and the relative strength index (RSI) is just above the midpoint, suggesting a status of equilibrium between the buyers and sellers. The bullish momentum is likely to pick up on a close above $44,700. There is a minor resistance at $45,879, but if this level is crossed, the possibility of a rally to $49,178 increases.
On the downside, a break below the 50-simple moving average will suggest that the bulls are tiring out. The pair may then drop to the support line of the triangle. Buyers will have to protect this level if they want to keep the bullish pattern intact.
Internet Computer price analysis
Internet Computer (ICP) has been in a sharp pullback for several days, suggesting that the bulls are rushing to the exit.

The bulls will try to arrest the correction at the 20-day EMA ($11.18). If the price rebounds off the 20-day EMA with strength, it will suggest that the sentiment remains positive and traders are buying on dips. The bulls will then make another attempt to propel the ICP/USDT pair to $14.40 and eventually to $16.
The risk to this assumption is that the RSI has formed a negative divergence, indicating weakening momentum. A break and close below the 20-day EMA will signal that the uptrend may be over in the near term.

The moving averages have completed a bearish crossover, and the RSI is trading in the negative territory, suggesting that the short-term trend favors the bears. If the price skids below $11.70, the pair could plunge to $11 and then to $9.36.
The bulls will have to push and sustain the price above the moving averages to signal that the correction may be over. That could start an up move to $15 and thereafter to $16. This level may again attract strong selling by the bears.
Arbitrum price analysis
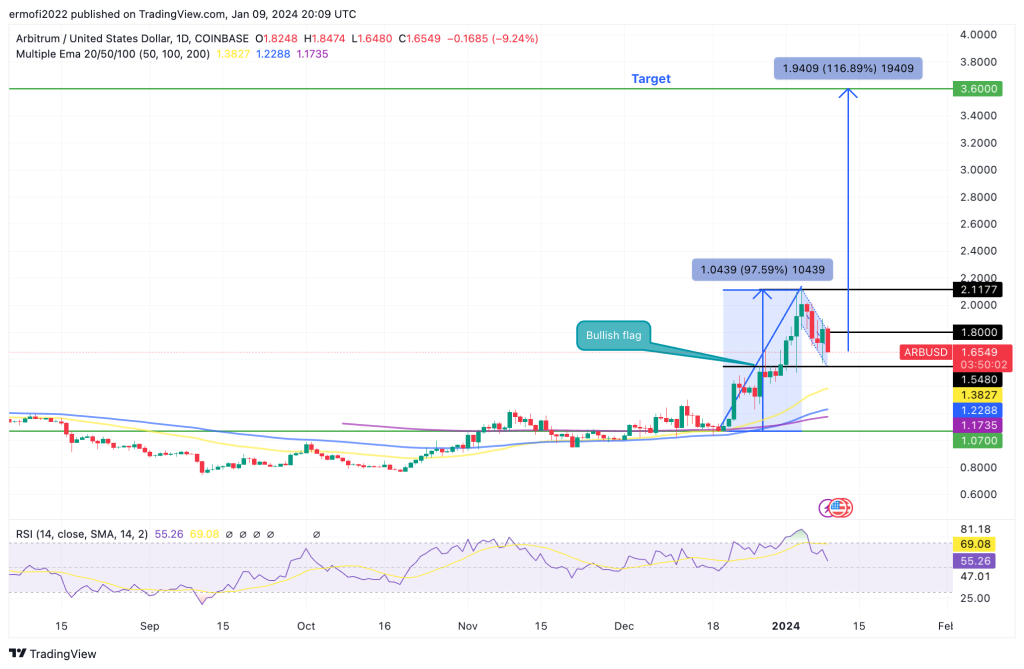
Arbitrum (ARB) failed to sustain above $2, which may have tempted short-term traders to book profits. That pulled the price to the breakout level of $1.75.

The ARB/USDT pair is likely to witness a tough battle between the buyers and sellers near the $1.75 level. If the price turns up sharply from $1.75, it will indicate that the bulls have flipped the level into support. That will increase the likelihood of a retest of the Jan. 4 high of $2.11. A break above this level could start the next leg of the uptrend to $2.50.
Instead, if the $1.75 level cracks, the pair may drop to the 20-day EMA ($1.59). The bulls will have to fiercely defend this level because a slide below it may start a drop to $1.35.

The pair bounced off the $1.75 support but is facing stiff resistance at the 20-EMA. This is a negative sign as it shows that traders are viewing the rallies as a selling opportunity. The bears will try to strengthen their position by dragging the price below the 50-SMA. If they succeed, the pair may plunge to $1.50.
If buyers want to prevent the decline, they will have to quickly push the price above the 20-EMA and then the overhead resistance at $1.96. That may set up a retest of the overhead resistance at $2.12.
Related: Bitcoin ETFs will solve unit bias psychology, says VanEck adviser
Stacks price analysis
Stacks (STX) turned down from the overhead resistance of $1.78 on Jan. 5, but the pullback was short lived.

The price turned up from the 20-day EMA ($1.47) on Jan. 6, indicating that the bulls continue to buy on dips. The bulls have pushed the price to the $1.78 resistance, where they are likely to encounter strong selling by the bears. If buyers clear the overhead hurdle, the STX/USDT pair could travel to $2.20 and then $2.50.
Contrarily, if the price turns down sharply from the current level, the pair may oscillate between the 20-day EMA and $1.78 for some time. The bears will have to yank the price below the 20-day EMA to start a deeper correction toward $1.20.

The pair has reached the overhead resistance of $1.78, which remains the crucial short-term level to watch out for. If buyers overcome this barrier, it will signal the start of the next leg of the up move. The pair may then start a journey to $2.
On the contrary, if the price turns down sharply from $1.78, it will suggest that the bears continue to guard the level. The pair may drop to the moving averages and then to $1.36. A bounce off this level could keep the pair inside the $1.36 to $1.78 range for a while.
Maker price analysis
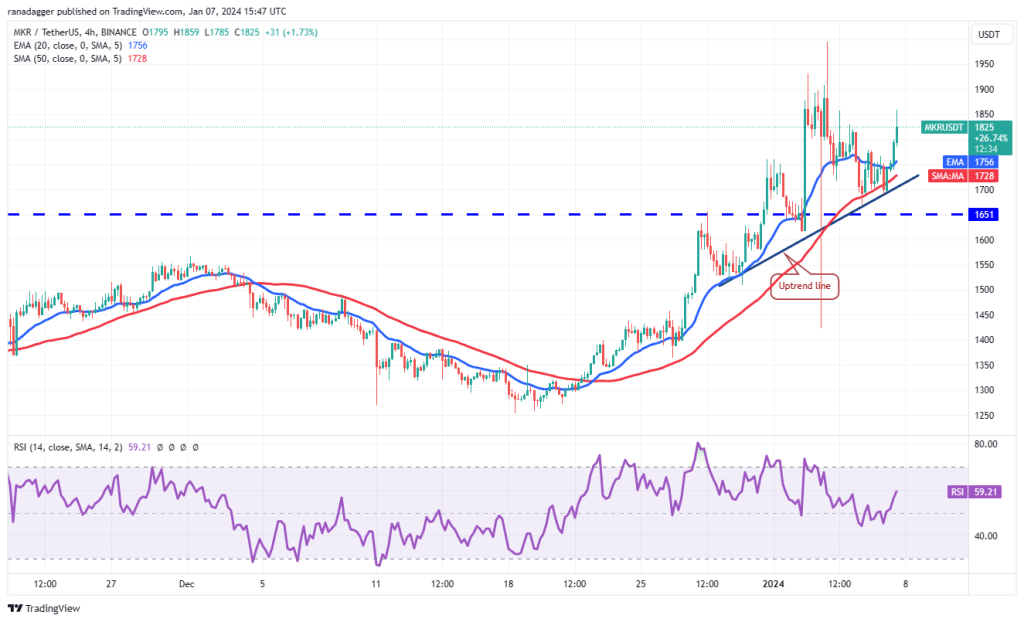
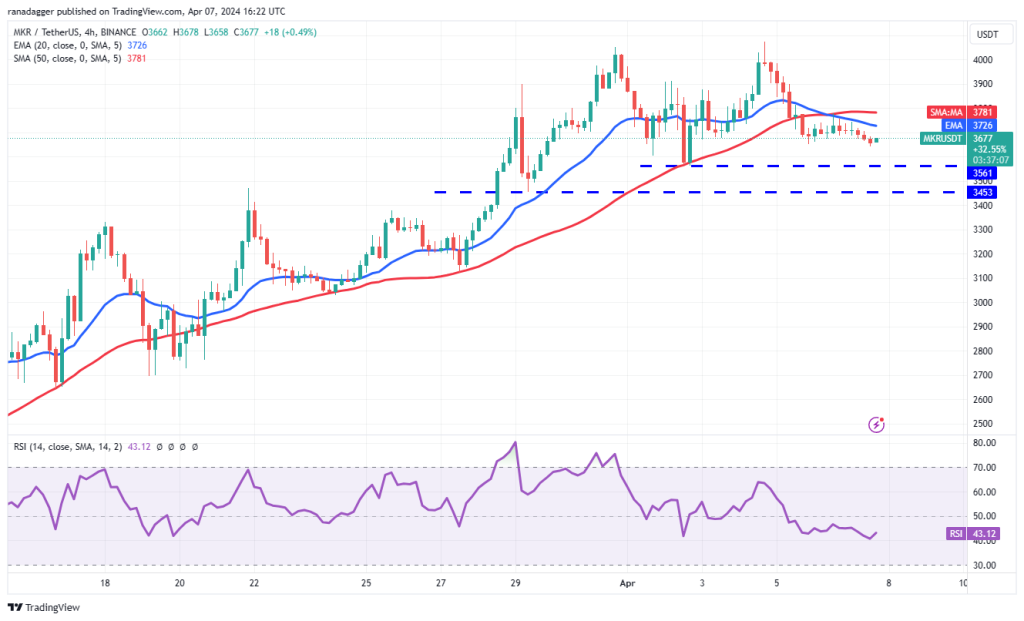
Maker (MKR) pulled back in an uptrend, but a minor positive is that the bulls did now allow the price to slip back below the breakout level of $1,651.

The 20-day EMA ($1,615) is sloping up, and the RSI is near the overbought zone, indicating an advantage to buyers. If the rebound off $1,651 holds, it will signal that the bulls have flipped the level into support. The MKR/USDT pair could then attempt a rally to the overhead resistance at $2,000.
The 20-day EMA is the crucial support to watch out for on the downside. A break and close below this level may pull the pair to the 50-day SMA ($1,483).

The bulls purchased the dip to the uptrend line on the 4-hour chart, signaling solid buying at lower levels. The bulls pushed the price above the 20-EMA and are attempting to extend the recovery above the $1,825 resistance. If they manage to do that, the pair may climb to $1,900 and later to $2,000.
The bears will have to sink the price below the uptrend line to weaken the bulls. The selling could accelerate if the $1,651 level breaks. The pair may then dive to $1,500.


… [Trackback]
[…] There you can find 38869 more Information on that Topic: x.superex.com/academys/markets/1792/ […]
… [Trackback]
[…] Find More Info here on that Topic: x.superex.com/academys/markets/1792/ […]
… [Trackback]
[…] Read More here on that Topic: x.superex.com/academys/markets/1792/ […]
… [Trackback]
[…] Find More Info here to that Topic: x.superex.com/academys/markets/1792/ […]
… [Trackback]
[…] Information to that Topic: x.superex.com/academys/markets/1792/ […]
… [Trackback]
[…] Here you can find 51732 more Information to that Topic: x.superex.com/academys/markets/1792/ […]
… [Trackback]
[…] Find More on that Topic: x.superex.com/academys/markets/1792/ […]
… [Trackback]
[…] There you will find 20452 additional Information to that Topic: x.superex.com/academys/markets/1792/ […]
… [Trackback]
[…] There you will find 92369 more Information on that Topic: x.superex.com/academys/markets/1792/ […]
… [Trackback]
[…] Find More here to that Topic: x.superex.com/academys/markets/1792/ […]
… [Trackback]
[…] Read More on on that Topic: x.superex.com/academys/markets/1792/ […]
… [Trackback]
[…] Find More Information here on that Topic: x.superex.com/academys/markets/1792/ […]
… [Trackback]
[…] Find More Information here to that Topic: x.superex.com/academys/markets/1792/ […]
… [Trackback]
[…] Read More Information here on that Topic: x.superex.com/academys/markets/1792/ […]
… [Trackback]
[…] Find More to that Topic: x.superex.com/academys/markets/1792/ […]
… [Trackback]
[…] Read More on that Topic: x.superex.com/academys/markets/1792/ […]
… [Trackback]
[…] Here you can find 76816 more Info to that Topic: x.superex.com/academys/markets/1792/ […]
… [Trackback]
[…] Find More Info here on that Topic: x.superex.com/academys/markets/1792/ […]
… [Trackback]
[…] Read More on on that Topic: x.superex.com/academys/markets/1792/ […]
… [Trackback]
[…] Info on that Topic: x.superex.com/academys/markets/1792/ […]
… [Trackback]
[…] Read More to that Topic: x.superex.com/academys/markets/1792/ […]
… [Trackback]
[…] Info to that Topic: x.superex.com/academys/markets/1792/ […]
… [Trackback]
[…] Read More on that Topic: x.superex.com/academys/markets/1792/ […]
… [Trackback]
[…] Information on that Topic: x.superex.com/academys/markets/1792/ […]