LEARN BOLLINGER BANDS WIDTH IN 3 MINUTES – BLOCKCHAIN 101

Introduction
Bollinger Bands Width might sound unfamiliar to some, but for traders and investors, it could be a powerful tool. This technical indicator was developed by John Bollinger in the 1980s and can not only help measure the strength of market price fluctuations but also provide vital information about trends.
Explanation of Bollinger Bands:
Bollinger Bands consist of three main components. The middle band, usually a 20 or 21-day moving average, represents the trend of the price. The upper band is calculated by adding two times the standard deviation to the middle band. The lower band is derived by subtracting two times the standard deviation from the middle band. The essence of Bollinger Bands is that when there’s significant market volatility, the bands widen, and when the market is less volatile, the bands contract.

Uses and Advantages of Bollinger Bands Width
Uses:
Measuring Price Volatility: Bollinger Bands Width is used to measure the magnitude of price volatility. Narrow bandwidth indicates minor market price fluctuations, suggesting a relatively stable market. Conversely, a wider bandwidth denotes significant market price movements, indicating a volatile market period. This helps traders understand potential risks and opportunities in the market.
Assessing Trend Strength: Bollinger Bands Width can also be used to determine the strength of a price trend. If there’s a strong price trend, the bandwidth will typically expand, while in weaker price trends or sideways consolidations, it usually contracts. This can guide traders on when to enter or exit the market.
Identifying Volatility Breakouts: Traders can utilize Bollinger Bands Width to spot signals of price volatility breakouts. A sudden expansion or contraction in bandwidth might suggest an impending significant price movement, allowing traders to devise appropriate trading strategies.
Combining with Other Indicators: Bollinger Bands Width can be combined with other technical indicators, like the Relative Strength Index (RSI) or moving averages, to offer a more comprehensive market analysis. This enhances the accuracy of trading and investment decisions.
Advantages:
Simplicity: The calculation method for Bollinger Bands Width is relatively straightforward and easy to understand. This makes it suitable for traders of all levels, including beginners.
Versatility: This indicator can be used for chart analysis across different time frames, accommodating various trading and investment strategies. Both short-term traders and long-term investors can benefit from it.
Market Insight: Bollinger Bands Width provides essential information about market volatility and trends, helping traders get a better grasp of the current market situation. This helps reduce the risk of trading and investing blindly.
Real-time Monitoring: Trading software usually calculates and displays Bollinger Bands Width in real-time, allowing traders to track market changes promptly and make decisions accordingly.
Bollinger Bands Width Calculation:
The calculation for Bollinger Bands Width is relatively simple. It is calculated using the following formula:
Bollinger Bands Width = (Upper Band−Lower Band)/Middle Band
Where:
- The Upper Band is the upper track of the Bollinger Bands, typically the Middle Band plus two times the standard deviation.
- The Lower Band is the lower track of the Bollinger Bands, typically the Middle Band minus two times the standard deviation.
- The Middle Band is usually the simple moving average of the price, often using a 20-day or 21-day moving average.
Using this formula, you get a percentage value that represents the distance between the upper and lower bands relative to the middle band. This percentage is the Bollinger Bands Width, used to gauge the magnitude of price volatility.
Application of Bollinger Bands Width:
Now, let’s see how Bollinger Bands Width is applied in actual markets. When the Bollinger Bands Width is narrow, it typically indicates that the market is in a relatively stable phase. This could mean that price volatility is low, and the market is calm. Conversely, when the Bollinger Bands Width is wide, it indicates higher price volatility, suggesting that the market might be entering a more turbulent period.
Case Study:Analyzing Bitcoin Price Trends
Suppose we want to analyze the price action of Bitcoin (BTC) and use the Bollinger Bands Width to determine the strength of market volatility and trends. We will use the following data:
Middle track (20-day simple moving average): $50,000
Upper Rail: $55,000
Lower Rail: $45,000
Now, let’s calculate the Bollinger Bands Width:
Calculate the distance between the top and bottom rails:
Upper Band – Lower Band = $55,000 – $45,000 = $10,000
Calculate Bollinger Bands Width:
Bollinger Bands Width = \frac{{Upper Band – Lower Band}}{{Middle Band}} = \frac{{$10,000}}{{$50,000}} = 0.20 = 20%
In this example, the Bollinger Bands Width is 20%, indicating that the distance between the top and bottom rails is 20% relative to the middle rail. This value tells us the price volatility of the Bitcoin market during this time period.
Explain this case:
In this specific case, the Bollinger Bands Width is at 20%. Such a relatively low value suggests that there is minimal price volatility in the market, indicating that it might be comparatively stable. This means that during this time frame, the price fluctuations of Bitcoin are not very pronounced.
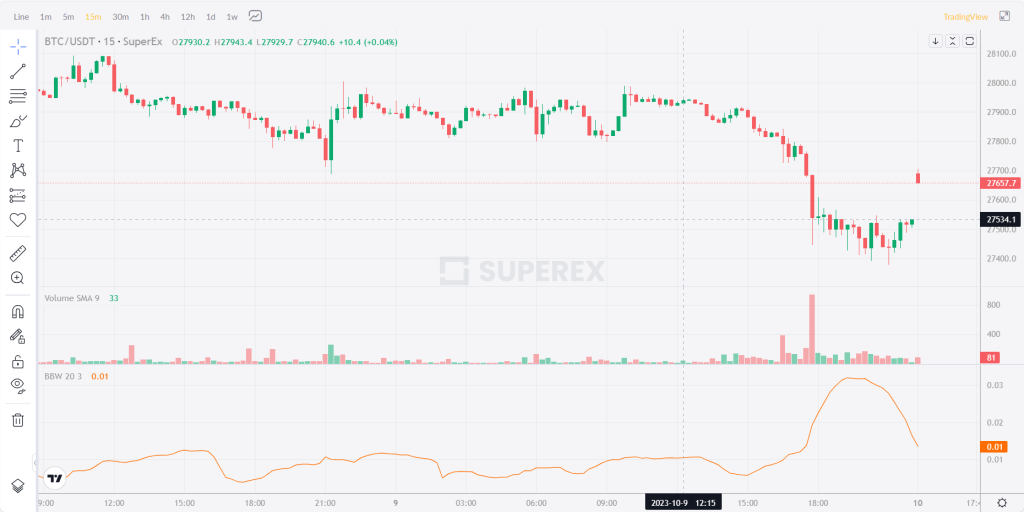
In the SuperEx trading market, the Bollinger Bands Width is presented as a complete technical indicator curve, so there’s no need for individual calculations, making it extremely convenient.
Once users select the Bollinger Bands Width indicator, a BBW curve appears below the candlestick chart. As illustrated in the given diagram (not provided here), we can observe that when the curve is at a lower point, the BTC price remains stable. Conversely, when the BBW curve is at a higher point, the BTC price experiences significant fluctuations.
Conclusion:
Traders can use the Bollinger Bands Width value in conjunction with other market data to formulate their trading strategies. If the Bollinger Bands Width is at a relatively low level, traders might notice that the market is calm and might choose to adopt a conservative approach. On the other hand, if the Bollinger Bands Width expands rapidly, it might suggest that the market is about to experience substantial price movements. Traders can then prepare for these market changes and devise appropriate risk management strategies.
Please note that this case is merely illustrative. Actual market analysis might necessitate considering a plethora of other factors, including other technical indicators, fundamental analysis, and market news. While the Bollinger Bands Width is a useful tool, it should be employed in conjunction with other information to make more informed trading and investment decisions.


Responses