LEARN MOVING AVERAGE TRIPLE(MAT)IN 3 MINUTES – BLOCKCHAIN 101

In the trading market, no indicator is absolutely accurate. The market sometimes produces misleading signals, especially for markets with low capitalization like cryptocurrencies, where misleading signals are more frequent than in traditional financial markets. It’s usually necessary to combine other technical indicators and risk management strategies to make decisions.
Today, we’re going to discuss a classic multi-indicator strategy. In previous lessons, we’ve gone into great detail about the meaning and usage of the MA (Moving Average) indicator. As we all know, MAs are categorized into Short-term Moving Averages, Intermediate-term Moving Averages, and Long-term Moving Averages. Today, we’re going to talk about the MOVING AVERAGE TRIPLE (MAT) indicator, a comprehensive strategy that combines moving averages from three different time frames for asset price trend analysis.

What is MOVING AVERAGE TRIPLE (MAT)
The concept of the Moving Average Triple is very old, with its history tracing back to the early days of technical analysis. It has been refined and applied by various technical analysts and traders at different times and places. The main idea behind this indicator is to capture asset price trends by using moving averages of different time periods, and to formulate trading strategies based on these trends. Below are key points in the history and development of this indicator:
Origin of Moving Averages: Moving averages were originally used to analyze the trends in stock prices. The simplest form of moving average is the Simple Moving Average (SMA), which uses the average price over a specific period as a reference point. SMAs are very useful in analyzing trends and price support/resistance but can lag in fast-moving markets.
Introduction of Exponential Moving Averages (EMA): To more quickly react to the most recent price changes, technical analysts introduced Exponential Moving Averages (EMA). EMAs give greater weight to the latest prices, allowing them to adapt more quickly to market changes.
Development of Triple Moving Averages: Triple Moving Averages are a combination of SMA and EMA. They consist of three different time-frame moving averages, typically short-term, intermediate-term, and long-term. This combination allows analysts to consider price trends over different periods, offering a more comprehensive analysis.
Expanding Application Areas: Triple Moving Averages are not only used in the stock market but are also widely applied in forex markets, cryptocurrency markets, and commodity markets among various other financial markets. They are also used for different types of assets, including stocks, currencies, commodities, and digital assets.
Automation and Computational Tools: With advancements in computational technology, modern trading platforms and analysis tools now offer automated calculation and visualization features for the Moving Average Triple indicator, making it easier for traders to use this technical analysis tool.
Advantages of MOVING AVERAGE TRIPLE (MAT)
Smoothing Price Data: The Triple Moving Average includes moving averages from different periods. The long-term moving average is particularly smooth, helping to filter out short-term price volatility. This helps traders more clearly identify trends.
Multi-Time Frame Analysis: By considering short-term, intermediate-term, and long-term trends simultaneously, the Triple Moving Average offers more comprehensive analysis. This helps to identify trends on different time scales, assisting traders in making more informed decisions.
Trend Confirmation: When the short-term moving average crosses above the intermediate-term and long-term moving averages, a “Golden Cross” is formed. This is often seen as a buy signal, confirming an upward trend. Conversely, when the short-term moving average crosses below the intermediate-term and long-term moving averages, a “Death Cross” is formed, typically viewed as a sell signal confirming a downward trend.
Ease of Understanding: Compared to some other complex technical indicators, Triple Moving Averages are relatively simple and easy to understand and use. This makes them a good starting point for novice traders looking to get into technical analysis.
Wide Applicability: Triple Moving Averages are not only applicable to stock markets but also can be used in forex markets, cryptocurrency markets, and commodity markets, among other financial markets. They are also applicable to different types of assets.
Practical Implementation of MOVING AVERAGE TRIPLE (MAT)
Triple Moving Average is an indicator used for technical analysis to analyze asset price trends and formulate trading strategies. Below are the general steps for the practical implementation of this indicator:
Select Appropriate Time Frames: First, you need to select suitable time frames for calculating the Triple Moving Averages. This includes short-term, intermediate-term, and long-term moving averages. Common periods include 5-day, 10-day, 20-day, 50-day, 100-day, and 200-day.
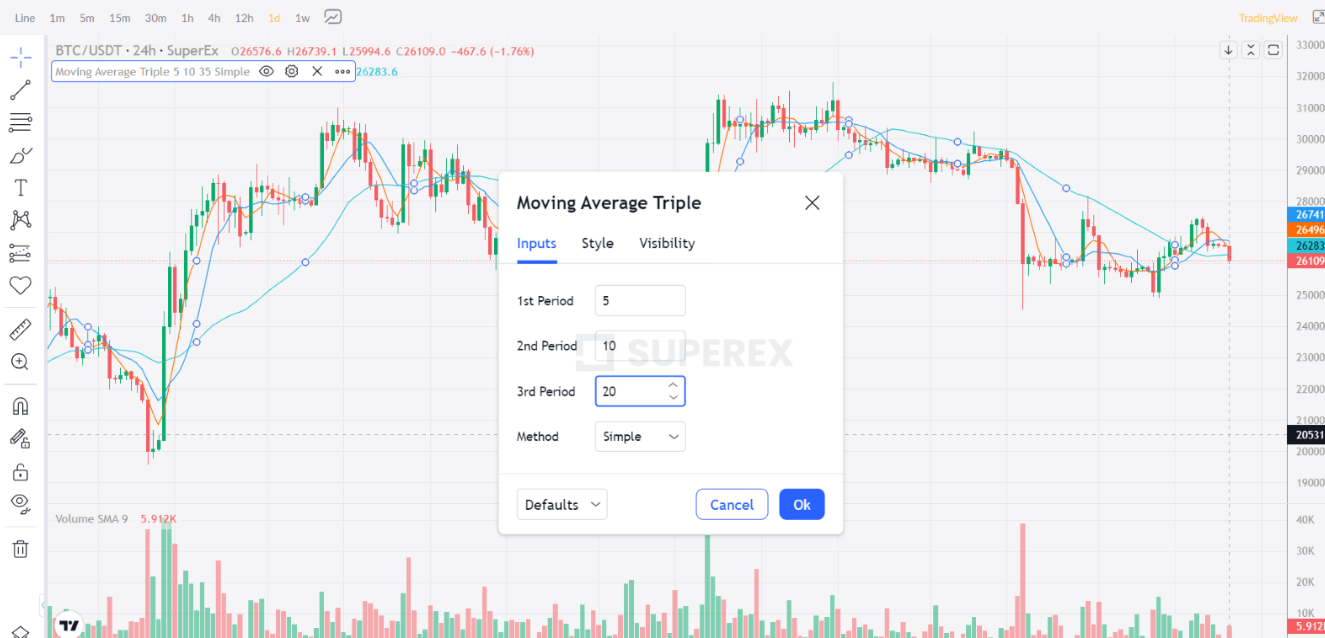
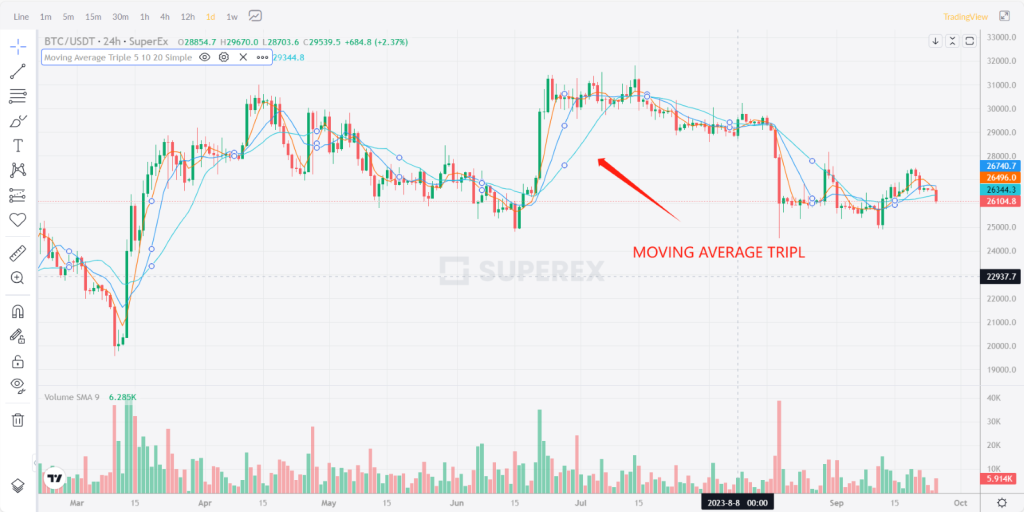
Plot the Triple Moving Averages: Based on the time frames you’ve chosen, plot the short-term, intermediate-term, and long-term moving averages. These averages are generally displayed on price charts, forming a set of curves.
Observe Crossover Signals: The main use of Triple Moving Averages is to observe crossover signals. A Golden Cross is formed when the short-term moving average crosses above the intermediate-term and long-term moving averages, which is considered a buy signal. Conversely, a Death Cross is formed when the short-term moving average crosses below the intermediate-term and long-term averages, which is considered a sell signal.
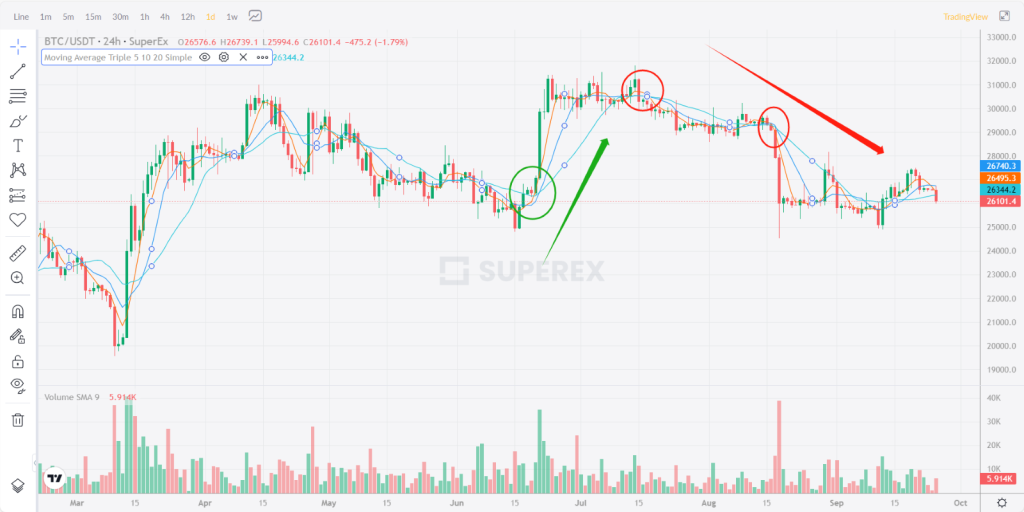
Confirm the Trend: Use Triple Moving Averages to confirm price trends. If the price is in an upward trend and a Golden Cross signal appears, this could be a buying opportunity. Conversely, if the price is in a downward trend and a Death Cross signal appears, this could be a selling opportunity.
Set Stop-Loss and Profit Targets: Before entering a trade, setting stop-loss and profit targets is a crucial step in risk management. Stop-loss can help limit potential losses, while profit targets can help lock in gains. These levels can typically be determined based on the positions of the moving averages and market volatility.
Execute Trades: Based on the signals and trend confirmation from the Triple Moving Averages, execute buy or sell trades. Ensure that your trading platform supports the asset type and trading methods you’ve chosen.
Monitor Trades: Once in a trade, continue to monitor market conditions and adjust your trading strategy based on further signals and price behavior from the moving averages. Don’t overlook dynamic market changes.
Please note that although the Triple Moving Average can provide useful trend signals, it is not an absolutely accurate indicator and may produce false signals. Therefore, it is advisable to use it in conjunction with other technical analysis tools and your own trading strategy. Most importantly, adhere strictly to risk management principles in trading, and never put all your chips into a single trade.


Responses