LEARN HULL MOVING AVERAGE(HMA)IN 3 MINUTES – BLOCKCHAIN 101

Hull Moving Average (HMA), a smooth trend indicator, is increasingly popular in the field of technical analysis. Created by Alan Hull, it is praised as a tool capable of filtering out noise in market data while quickly reacting to price changes. This article delves into the principles, advantages, and practical applications of HMA in trading.

Principles of HMA
The Hull Moving Average (HMA) was developed by Australian financial analyst Alan Hull in 2005. Alan Hull is a well-known technical analyst and author, and HMA is one of the indicators he created.
The initial motivation behind Hull’s development of HMA was to address some of the issues associated with traditional moving averages, such as Simple Moving Averages (SMA) and Exponential Moving Averages (EMA), particularly their lag and noise. Traditional moving averages tend to react slowly to price data, thereby potentially delaying the identification of market trend changes. Moreover, they are easily influenced by price fluctuations, producing many irrelevant signals.
To overcome these issues, Hull designed the HMA, a more smooth and responsive average. The HMA’s calculation is based on the Weighted Moving Average (WMA) and combines two different periods of WMA. This combination allows the HMA to better adapt to market price changes while reducing noise.
The development of HMA has received wide recognition and is used by many technical analysts and traders for market analysis and trading strategy formulation. It is particularly useful in short-term and medium-term trading as it can quickly capture changes in price trends while maintaining smoothness, thereby reducing the occurrence of false signals.
The core principle of HMA is to combine different periods of Weighted Moving Averages (WMAs) to smooth out price data. Compared to traditional Simple Moving Averages (SMAs) or Exponential Moving Averages (EMAs), HMA is more competitive in reducing noise and lag. This is achieved in the following ways:
- Smoothness: HMA uses two different WMAs to smooth out price data, making it more effective in reducing price volatility. The result is a cleaner, smoother line that helps traders more easily identify trends.
- Quick Response: Not only does the HMA smooth out price data, but it also reacts to price changes at a faster rate. This is especially beneficial for traders who need to quickly capture short-term trends.
- Reducing Lag: By design, the HMA can reduce lag, meaning it adapts more quickly to market price changes. This broadens its applicability in the marketplace.

Advantages of the Hull Moving Average (HMA) Indicator
The Hull Moving Average (HMA) has several advantages that make it popular for technical analysis and trading. Below are the main advantages of the HMA indicator:
- Quick Response to Price Changes: The HMA has a faster response rate compared to traditional Simple Moving Averages (SMA) and Exponential Moving Averages (EMA). This means it can capture market price changes more quickly, especially useful for tracking short-term trends.
- Smoothness: The design of the HMA aims to reduce noise in price data by smoothing the price curve, making trends easier to discern. Compared to SMA and EMA, the HMA is more effective in filtering out price fluctuations and reducing the occurrence of false signals.
- Reduced Lag: Lag is a problem with traditional moving averages, which can be delayed in reflecting market trend changes. The HMA is designed to minimize lag, thus adapting more quickly to market price changes.
- Strong Adaptability: The HMA calculation includes two different periods of Weighted Moving Averages (WMA), allowing it to better adapt to fluctuations in market prices. This adaptability makes the HMA viable in different types of markets and trading cycles.
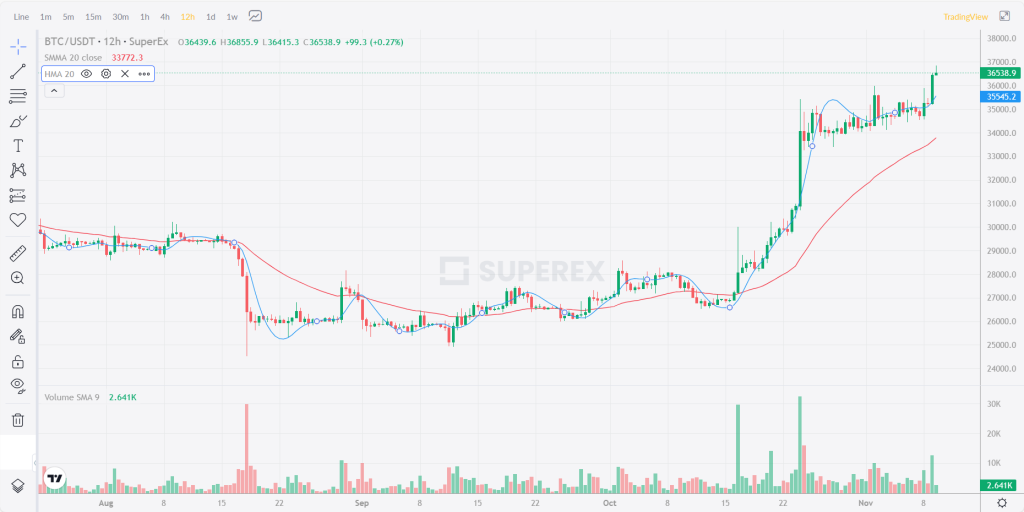
- Trend Confirmation: The HMA can be used to confirm the direction of market trends. When the HMA slopes upward, an upward trend may be present; when it slopes downward, a downward trend may exist. This helps traders identify and follow the primary trend.
- Crossover Signals: The crossover points of the HMA are often used as buy or sell signals. For example, when the HMA crosses above the price line from below, it could be a buy signal.
- Support and Resistance: The values of the HMA can be used to determine the levels of price support and resistance, which helps traders establish appropriate stop-loss and take-profit points.
- Versatility: The HMA is not only applicable to the stock market but also relevant for the forex market, cryptocurrency market, and other trading markets. This diversity makes it part of various trading strategies.
Roles of Hull Moving Average (HMA) Indicator in the Market
The Hull Moving Average (HMA) indicator has a wide range of uses in practical applications, especially in technical analysis and trading. Below are some of the practical applications of the HMA indicator:
- Confirming Trends: The HMA can be used to confirm the direction of market trends. When the HMA line is sloping upwards, it suggests that an upward trend may be present, potentially signaling a buy. Conversely, when the HMA line slopes downward, a downward trend may be in place, potentially signaling a sell.
- Crossover Signals: Crossovers of the HMA are often used to generate buy or sell signals. When the HMA line crosses above the price line from below, it could be a buy signal. When the HMA line crosses below the price line from above, it could be a sell signal. These crossover signals are very useful for determining entry and exit points.
- Support and Resistance: The values of the HMA can be used to identify levels of price support and resistance. When the price approaches the HMA line, it can act as support or resistance, aiding traders in setting appropriate stop-loss and take-profit levels.
- Dynamic Stop-Loss Strategy: The HMA can be used to formulate a dynamic stop-loss strategy. Traders can use the HMA value as a reference to adjust stop-loss levels depending on the relative position of the price to the HMA. For example, when the price is above the HMA, the stop-loss can be set below the HMA to protect profits.
- Noise Filtering: The smoothness of the HMA makes it highly effective in filtering out market noise. This helps traders identify true trends and avoid being misled by short-term fluctuations.
- Multi-Timeframe Analysis: Traders often use multiple HMA indicators, each with different time periods, to analyze trends on different time scales simultaneously. This helps to better understand the overall market dynamics.
- Combination with Other Indicators: The HMA is often used in conjunction with other technical indicators, such as the Relative Strength Index (RSI), Stochastic Oscillator, or moving average crossovers, to enhance the accuracy of trading decisions.
- Customizable Parameters: The parameters of the HMA indicator can be customized according to the needs of traders. Traders can choose different time periods and weights to adapt to the requirements of different markets and trading strategies.
It should be noted that while the HMA is a useful technical tool, it is not infallible and cannot guarantee 100% success. Traders should use the HMA in conjunction with other analytical tools and their own trading plans, while also practicing appropriate risk management. The best approach is to test the effectiveness of the HMA in demo trading or with small trades, then adjust and improve based on actual experience.
Hull Moving Average (HMA) Indicator: A Case Study
Background:
Suppose you are a cryptocurrency trader considering buying Bitcoin (BTC). You want to use the HMA to determine entry points.
- Calculate HMA Values:
Select Two Time Periods: First, select two time periods: 12 hours and 1 day. These periods will be used to calculate the HMA.
1.1 Get Historical Price Data: Obtain historical price data for Bitcoin for calculations. In this case, we consider only the most recent data points to simplify calculations. Assume the last 4 hourly prices are as follows:
- 12 hours ago: $40,000
- 11 hours ago: $40,100
- 10 hours ago: $40,300
- 9 hours ago: $40,400
Calculate WMA1 and WMA2: Use the selected two time periods to calculate the 12-hour WMA1 and the 1-day WMA2. First, calculate the 12-hour WMA1:
- 12-hour WMA1 = [2 * WMA(6-hour) – WMA(12-hour)] / 2 Where WMA(6-hour) = ($40,100 + $40,300) / 2 = $40,200
- WMA(12-hour) = ($40,000 + $40,100 + $40,300 + $40,400) / 4 = $40,200
- Therefore, 12-hour WMA1 = [2 * $40,200 – $40,200] / 2 = $40,200
Then, calculate the 1-day WMA2:
- 1-day WMA2 = [2 * WMA(12-hour) – WMA(1-day)] / 2 Where WMA(12-hour) = $40,200
- WMA(1-day) = ($40,000 + $40,100 + $40,300 + $40,400) / 4 = $40,200
- Therefore, 1-day WMA2 = [2 * $40,200 – $40,200] / 2 = $40,200
Calculate HMA: Use the values of WMA1 and WMA2 to calculate HMA, according to the following formula:
- HMA = WMA1(WMA2)
- HMA = $40,200($40,200)
- HMA = $40,200^2 / $40,200 = $40,200
- Therefore, the calculated HMA value is $40,200.
Determine Entry Points:
Assume the current price of Bitcoin is $40,250. You can use the HMA value to determine the entry point:
- If the HMA value is higher than the current price, it might indicate an upward trend, possibly serving as a buy signal.
In this case, the HMA value of $40,200 is below the current price of $40,250, so you might wait for more signals or for the HMA to rise above the price before considering a buy.
In summary, the Hull Moving Average (HMA) indicator provides a powerful tool for technical analysis and trading with its smoothness, quick responsiveness, and reduced lag. However, like any technical indicator, successful trading does not solely depend on the tool itself but also requires a sensible trading plan, risk management strategy, and discipline. Traders should apply the HMA indicator judiciously based on their trading style and market conditions.


Responses