LEARN GOLDEN CROSS AND DEATH CROSS IN 3 MINUTES – BLOCKCHAIN 101
Introduction:
- What is a golden fork?
- What is a dead fork?
- The difference between a golden fork and a dead fork
- Common golden cross indicators
Foreword
The chart forms of technical analysis application are very rich. The topic of last class “Nine Common K-line Diagram Forms in Technical Analysis” was discussed. The “golden fork” and “dead fork” introduced today are also a common icon form in technical analysis, and their application scope is very wide. Whether it is short-term trading, doing band or long-term fixed investment, you can refer to them.
It is worth noting that learning the knowledge of the golden fork and the dead fork requires a certain understanding of the concepts of moving average (MA) and technical indicators. If you are in contact for the first time, please move to《3-minute learning technical indicators》In the article, first understand the pre-knowledge points.

So, what are the golden fork and the dead fork, and how do traders use them in market analysis and trading?
What is a golden fork?
Golden fork is a technical chart form and an important signal of market trend change.
The golden cross, also known as the “golden cross”, usually refers to a short-term moving average successfully crossing another long-term moving average. For example, the golden cross formed by the 5-day moving average successfully crossing the 10-day moving average is the signal that the K-line enters the rising band;
The golden cross is the performance that many parties occupy a favorable low position. Once the golden cross appears in the market, there is considerable room for growth in the market outlook, and the golden cross is the best time to enter the market.
The golden fork generally appears in three stages:
- In the downtrend, the short-term average is below the long-term average.
- The trend reversed and the short-term average crossed the long-term average.
- The short-term average remains above the long-term average, and the upward trend begins.
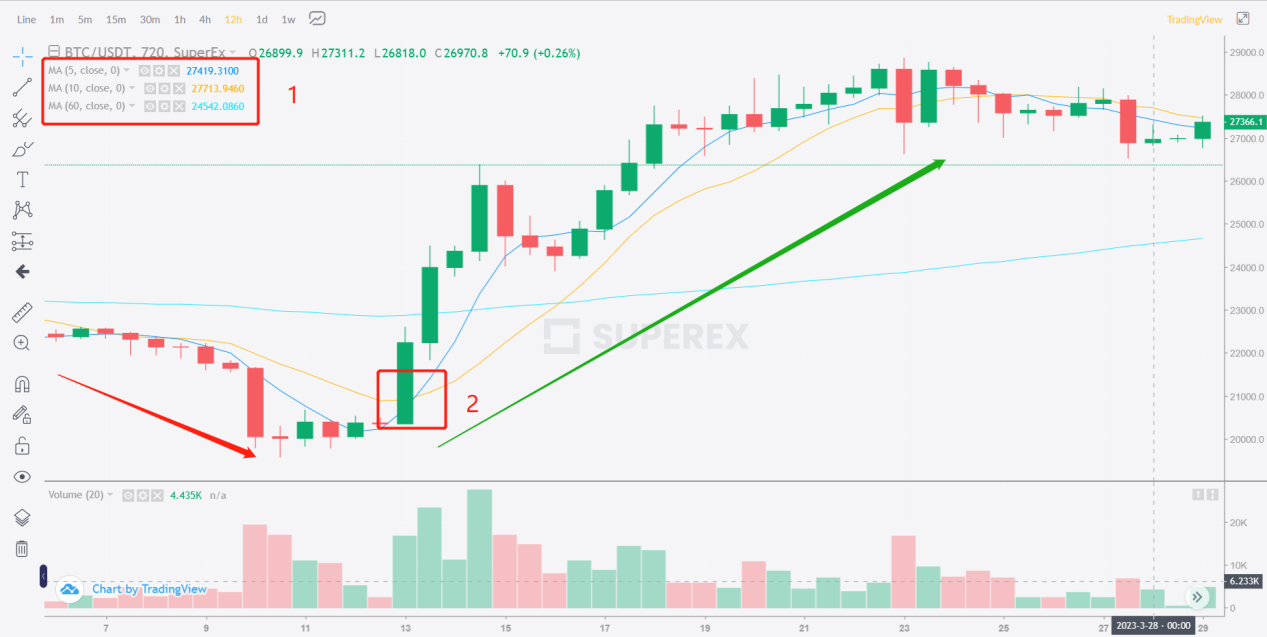
As shown in the figure below, we can see from Area 1 that the MA on the 5th is represented by blue line, and the MA on the 10th is represented by yellow line. At the intersection of Area 2, the blue line crosses the yellow line to form a golden cross. We can also see that the overall trend, after the formation of the golden fork, the original downward trend began to reverse, and a wave of ultra-long upward trend, which is the golden fork, and the golden fork is located at the recent trough, which is the best time to enter.
Why does the appearance of the golden fork represent the reversal of the trend?
The reason is very simple. We can know from the concept of MA that MA measures the average price of assets in a cycle. Simply understood, MA represents the price trend in the cycle, and MA on the 5th is the price trend in the 5th cycle.
From this perspective, we can draw such a conclusion. If the short-term MA is below the long-term MA, it means that compared with the long-term price trend, the short-term price is bearish. On the contrary, if the short-term MA is above the long-term MA, it means that the short-term price is bullish compared with the long-term price trend.
The prerequisite for the formation of the golden fork is that the short-term MA crosses the long-term MA, which means that the original short-term MA must be below the long-term MA. What happens when the short-term average crosses the long-term average? The short-term average price will be higher than the long-term average price. This shows the potential change of market trend, and the golden fork has therefore become a recognized bullish signal.
What is a dead fork?
The definition of the dead fork is just the opposite of the golden fork, which usually refers to the fact that a short-term moving average successfully crosses another long-term moving average. For example, the dead fork formed by the successful crossing of the 5-day moving average through the 10-day moving average is the signal that the K-line enters the downtrend band;
Death crossover is the performance of the empty side occupying a high position. Once there is a death crossover in the market, the decline in the market outlook is relatively large, so we should take a decisive position when the death crossover is formed.
The dead fork generally appears in three stages:
- In the upward trend, the short-term average is above the long-term average.
- The trend reversed and the short-term average fell below the long-term average.
- When the short-term average is continuously below the long-term average, there will be a downward trend.
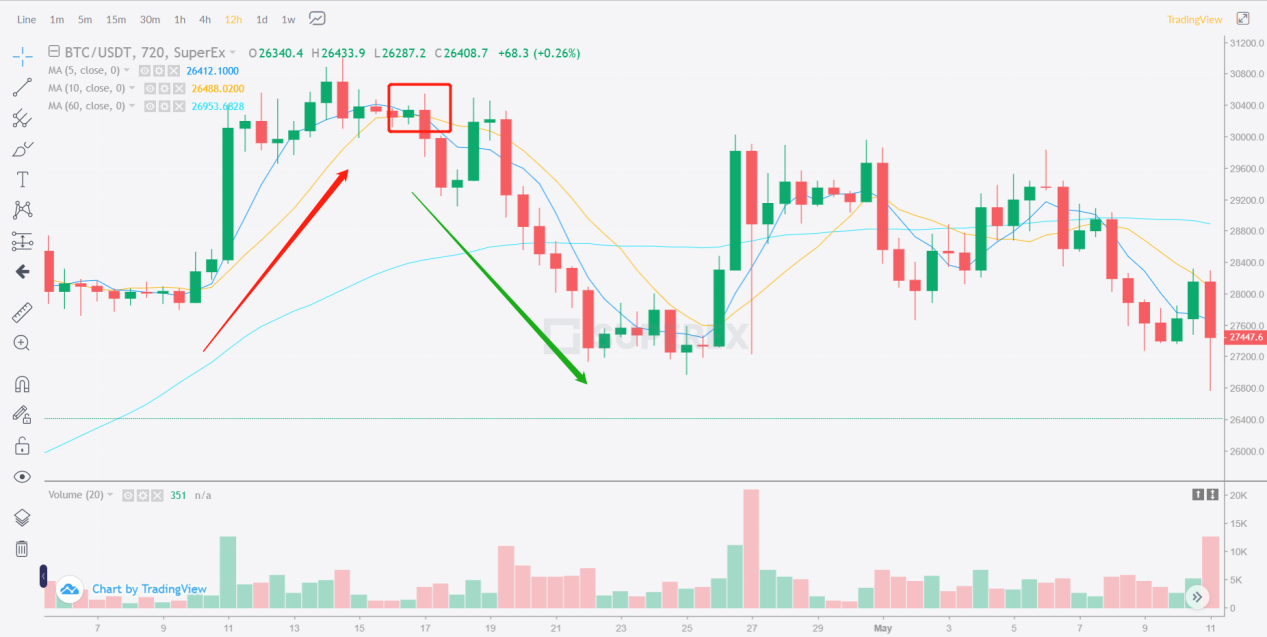
As shown in the figure below, in the red area, the 5th MA crosses the 10th MA, and the overall trend in the figure is reversed at the dead fork point, from rising to falling. Therefore, when the dead fork appears, it is one of the opportunities to leave.
After understanding the golden fork, we naturally understand why the dead fork is a bearish signal. The short-term average fell below the long-term average, indicating that the market outlook is bearish.
The difference between a golden fork and a dead fork
From the above, we can know that the golden fork and the dead fork are opposites with similar concepts and opposite positions. The golden fork is a bullish signal and the dead fork is a bearish signal.
Common golden fork/dead fork indicators
Golden fork and dead fork are a kind of chart form, which can be applied to many technical indicators, such as MA, MACD, KDJ and so on. These three kinds are also our commonly used technical indicators of golden fork/dead fork.
MA golden fork or dead fork
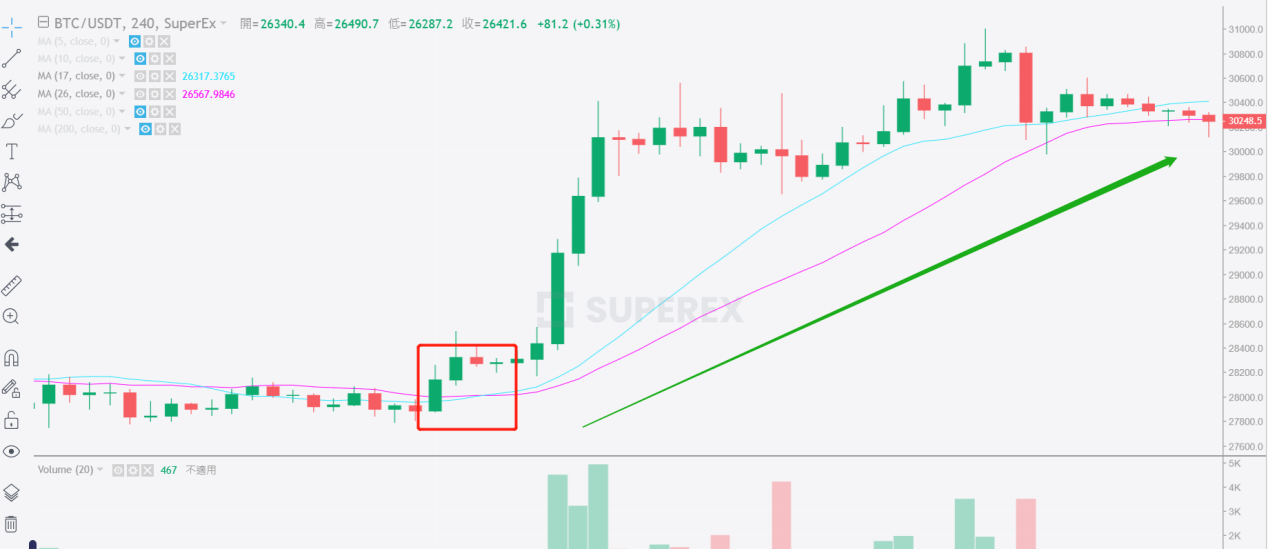
MA golden fork/dead fork refers to the shape of golden fork or dead fork based on the moving average index in the K-line chart. Common parameters include the combination of short and long lines such as 5th and 10th, 17th and 26th, 50th and 20th. Among them, 17th and 26th are also called Tongzi Line. The golden fork they formed is called Tongzi Golden Fork, and the dead fork is called Tongzi Dead Fork.
By way of digression, a gold cross or a dead cross is a very strong signal of market trend change, which is not common, but if you meet it, you can enter or leave decisively.
The figure below shows the gold fork of the sub-line, which is for reference only.
MACD golden fork or dead fork
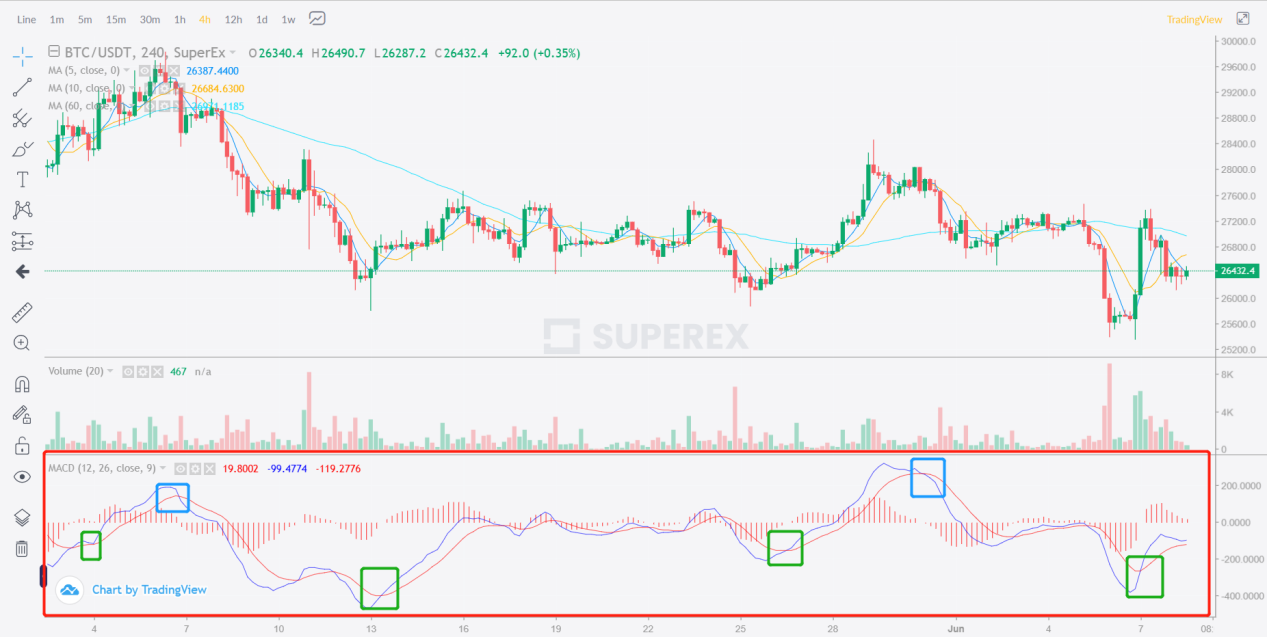
MACD golden fork or dead fork refers to the golden fork shape or dead fork shape in MACD indicators. As shown in the following figure, the golden fork points represented by green are the starting point of the upward trend and the bottom of the price, while the dead fork points represented by blue are the starting point of the downward trend and the top of the price.
KDJ gold fork or dead fork
KDJ index, also known as stochastic index, is a quite novel and practical technical analysis index. It was first used to analyze the contract market, and then widely used to analyze the short-term trend of the spot market. It is the most commonly used technical analysis tool in the contract and spot markets.
At this point, some people will definitely have questions. With so many indicators of golden fork and dead fork, which one should we look at?
We have repeatedly mentioned in previous articles that it is very dangerous not to draw a conclusion on the market with a single technical index. Many people look at the gold fork as well as the volume and other indicators. For multiple golden cross indicators.
If a single gold fork indicator appears in a currency, such as the MA gold fork, it means that the market is likely to rise.
If the MA golden fork appears at the same time, the MACD of the market also appears in the form of golden fork, which we call double golden fork, then the signal of market rise is much stronger than that of single golden fork.
If MA, MACD and KDJ all have the golden fork shape, we call it the triple golden fork, then excluding objective factors, such as malicious smashing, it normally indicates that the subsequent market trend is rising.
Therefore, the more gold forks, the more certain the upward trend of the market!
Summary
The golden cross means that the short-term moving average crosses the long-term moving average upward. A dead fork means that the long-term moving average falls below the short-term moving average. Whether it’s the stock market,foreign exchangestillCryptocurrencyIn the market, both indicators are reliable tools to confirm the long-term trend reversal.


Responses