LEARN CHAIKIN MONEY FLOW IN 3 MINUTES – BLOCKCHAIN 101
In financial market trading, there are thousands of various indicators, but the most core indicator is undoubtedly the category related to volume. Fund volume and liquidity are the most basic attributes of the entire market trading behavior. Whether it is lifting or smashing the market, volume is needed to support it.
Volume refers to the amount of assets traded during a specific period (usually a trading day). In the stock market, it represents the trading volume of stocks, and in the crypto market, it can represent the circulation of contracts or coins.

Importance of Volume:
- Market Health: Higher volume typically indicates a healthier market, as more buying and selling activity means the market is more liquid.
- Price Trend: A large amount of buying or selling can cause prices to rise or fall, so volume can help analyze price trends.
- Buy-Sell Signals: Some technical indicators, such as moving averages and the Relative Strength Index (RSI), are often used in conjunction with volume to identify buy or sell signals.
Money Flow:
Money flow refers to the inflow and outflow of funds over a period of time, usually related to volume. Money flow can further be divided into positive and negative, indicating funds inflowing and outflowing respectively.
Importance of Money Flow:
- Market Sentiment: Positive money flow may indicate a more optimistic market sentiment, while negative money flow may suggest a more pessimistic sentiment.
- Buy-Sell Pressure: Positive money flow can indicate greater buying pressure, while negative money flow can indicate greater selling pressure.
- Price Trend: The direction and strength of money flow can help analyze price trends and market dynamics.
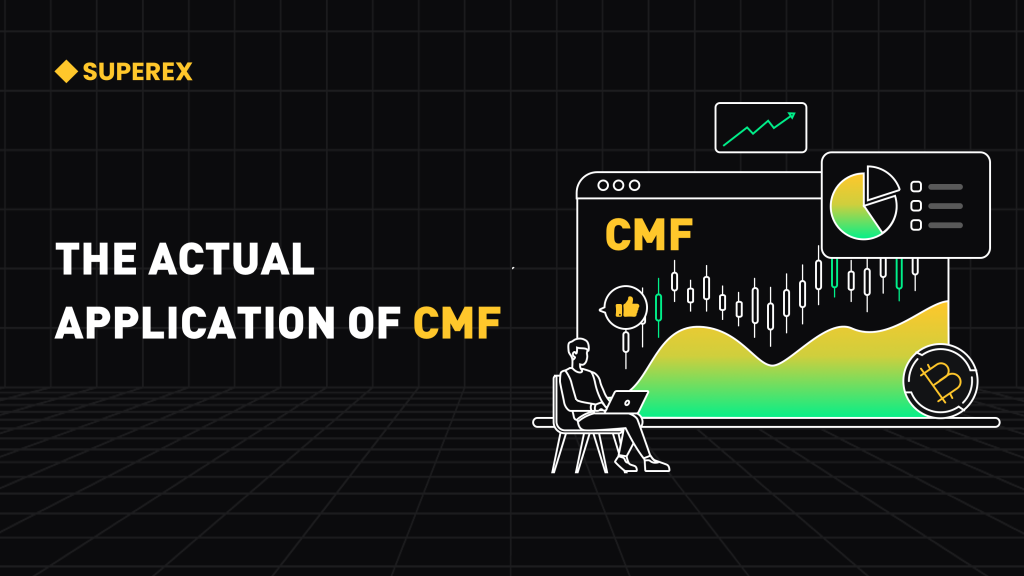
Today, we will study the CHAIKIN MONEY FLOW indicator, which belongs to the volume category and is used to measure the flow of funds in the secondary market.
What is Chaikin Money Flow (CMF)?
The Chaikin Money Flow (CMF) was developed by Marc Chaikin in the early 1980s, aiming to address the shortcomings of traditional money flow indicators. Traditional money flow indicators usually only consider the relationship between the closing price and the daily price range, while CMF introduces the factor of trading volume, providing a more comprehensive picture of market money flow.
The calculation of CMF is based on the following two key components:
Money Flow Multiplier (MF Multiplier): This value indicates the degree of money inflow or outflow on each trading day. It is calculated by comparing the day’s typical price (Typical Price) with the day’s price range (high and low). The MF Multiplier is given by: [(Typical Price – Low) – (High – Typical Price)] / (High – Low). This value measures the liquidity of funds on a particular trading day.
Money Flow Volume (MFV): This is the value obtained by multiplying the MF Multiplier with the day’s trading volume, representing the total inflow or outflow of funds on that trading day.
Then, the calculation of CMF can be divided into the following steps:
Calculate the 14-day exponential moving average (EMA) of the CMF value to smooth the indicator and provide clearer market signals.
The primary purpose of CMF is to measure the flow of funds in the market, providing traders with signals regarding buying and selling opportunities.
Generally, a positive CMF value may indicate money flowing into the market, while a negative CMF value may suggest money flowing out. CMF is commonly used to analyze the price trends and money flow of stocks, futures, and other financial assets.
Uses of Chaikin Money Flow (CMF):
- Measuring Fund Liquidity: CMF can help traders and investors understand whether money is flowing into or out of a specific asset. A positive CMF value indicates money flowing into the market, while a negative CMF indicates money flowing out. This helps in identifying buying and selling pressures in the market.
- Identifying Buy-Sell Signals: When CMF crosses the zero line, it might generate buy or sell signals. A shift from a negative to a positive CMF might be a buying signal, indicating money entering the market. Conversely, when CMF shifts from positive to negative, it might be a selling signal, indicating money leaving the market. These signals can guide trading decisions.
- Confirming Price Trends: CMF is often used in conjunction with price charts to confirm the reliability of price trends. When the CMF is consistent with the price trend, it might reinforce the validity of that trend. For instance, if the price is rising and the CMF is positive, it could strengthen the bullish trend.
- Supplementing Other Indicators: CMF can be used alongside other technical analysis tools and indicators to provide a more comprehensive market analysis. For example, it’s often combined with moving averages, Relative Strength Index (RSI), and others to further confirm market trends and buy-sell signals.
- Quantitative Analysis: For quantitative trading strategies, CMF can serve as a factor for model construction and decision-making. Quantitative traders can incorporate CMF with other data in automated trading systems.
Operational Guide for Chaikin Money Flow (CMF):
When operating with the Chaikin Money Flow (CMF) indicator, consider the following operational guidelines to better understand the market’s money flow and make more informed trading decisions:
- Observe the CMF Value: The CMF value reflects the intensity of money entering or leaving the market. A positive CMF value indicates money inflow, while a negative CMF value indicates money outflow. Pay special attention to whether CMF crosses the zero line, as this can be a crucial moment for buy or sell signals.
- Combine with Price Movements: View CMF alongside price charts to confirm the reliability of price trends. When CMF aligns with the price trend, it can reinforce the validity of the trend. For instance, a rising price with a positive CMF might suggest a strong upward trend.
- Watch for CMF Crossovers: A CMF crossing the zero line can generate buy or sell signals. A transition from negative to positive might indicate a buy signal (money entering the market), while a shift from positive to negative might indicate a sell signal (money exiting the market). However, don’t rely solely on these signals; consider other factors in combination.
- Use CMF with Other Indicators: CMF often works in tandem with other technical analysis tools to provide a comprehensive market analysis. For example, combine CMF with moving averages, the Relative Strength Index (RSI), and others to enhance decision-making accuracy.
- Confirm Trading Decisions: Don’t solely depend on CMF to make trading decisions. Consider it alongside other analysis methods, market trends, support, and resistance levels. Trading decisions should be holistic, not just based on a single indicator.
- Risk Management: Regardless of the indicators used, always prioritize risk management. Set stop-loss and take-profit levels, ensuring that your risk control strategy is executed in trades.
- Practice and Learn: Effective use of CMF requires practice and experience accumulation. Through market observation and simulated trading, your understanding and application of CMF can gradually improve.
Practical Example of Chaikin Money Flow (CMF) Operation:
Step 1: Data Collection Start by collecting historical price and volume data for the crypto asset of interest, usually provided in daily intervals or other time frames.
Step 2: Calculate Typical Price Compute the typical price for each trading day, which is foundational for CMF calculation. Typical Price = (Open + Close + High + Low) / 4.
Step 3: Calculate MF Multiplier The MF Multiplier measures liquidity, indicating the direction and strength of money flow on a particular trading day. The formula is: MF Multiplier = [(Typical Price – Low) – (High – Typical Price)] / (High – Low)
Step 4: Calculate Money Flow Volume (MFV) MFV represents the volume of money flow on a specific trading day, which is the product of MF Multiplier and the trading volume: MFV = MF Multiplier * Volume
Step 5: Calculate CMF CMF is the 14-day EMA of the cumulative sum of MFV. Start by selecting a start date, then compute the sum of MFVs over 14 days, followed by the 14-day EMA.
Step 6: Interpret CMF Value With the CMF value obtained, you can analyze the market scenario:
- A positive CMF value may imply a buy signal.
- A negative CMF value may suggest a sell signal.
- Fluctuations near the zero line may indicate sideways market movements.
This is a basic operational example of CMF. Remember, CMF is typically combined with other analysis tools for comprehensive market insights. Trading decisions should be comprehensive, not solely based on one indicator.


Responses