LEARN HISTORICAL VOLATILITY IN 3 MINUTES – BLOCKCHAIN 101

Introduction
Historical volatility is derived from past statistical analysis, assuming that the future is an extension of the past. Estimating volatility using historical methods is similar to estimating the standard deviation of a series of returns for an underlying asset.
In trading markets, historical volatility reflects the past fluctuations of an asset’s price. It is a technical indicator used to measure the degree of variation in an asset’s price over a period of time. Typically calculated based on historical price data, it helps investors assess the risk and expected range of price movements of an asset, thereby making more informed investment decisions.

What is the HISV Indicator
The history of Historical Volatility (HISV) dates back to the early 20th century, originating from studies on volatility and quantification. At that time, as investors’ interest in market volatility grew, there was a search for a method to measure the volatility of asset prices to better understand and manage risk. Historical Volatility emerged as a result of these efforts in the field of financial research.
This indicator is applied across various financial markets, including stocks, futures, and the cryptocurrency market. By analyzing the price fluctuations of an asset over a past period, investors can better predict the potential range of future price movements. The calculation of Historical Volatility is based on statistical principles, particularly the concept of standard deviation, enabling investors to quantify risk and formulate corresponding investment strategies.
Calculation Method of HISV Indicator
The calculation of Historical Volatility (HISV) typically relies on historical data of an asset’s price over a certain period. A common method of calculation involves using closing prices and follows these steps:
- Calculate Daily Returns: Daily returns refer to the percentage change between the closing prices of two consecutive trading days.
- Formula: Daily Return = (Today’s Close Price − Yesterday’s Close Price) / (Yesterday’s Close Price)
- Calculate the Standard Deviation of Daily Returns: Use the dataset of daily returns to calculate the standard deviation, which measures the extent of price fluctuations.
- Calculate Annualized Volatility: Multiply the standard deviation of daily returns by the square root of the number of trading days, typically 252, to obtain the annualized volatility. This is because there are usually 252 trading days in a year.
In simple terms:
- Select a time period, such as 30 or 60 days, as the calculation period for historical volatility.
- Calculate the logarithmic return for each trading day using the formula: ln(Pt/Pt-1), where Pt is the closing price of the current day, and Pt-1 is the closing price of the previous trading day.
- Compute the average of the logarithmic returns to estimate historical volatility.
Multiply the average by an adjustment factor, usually a standard deviation, to obtain the final value of historical volatility.
Judging the HISV Indicator
In conclusion: The higher the HISV indicator, the greater the market price fluctuation and risk, but it may also present greater opportunities for returns.
- Compare Current Volatility with Historical Average Volatility: Compare the current volatility with the average historical volatility of the asset. If the current volatility is significantly higher than the historical average, it may indicate a relatively volatile market period. Conversely, if the current volatility is lower, the market may be more stable.
- Observe the Trend of Volatility: Examine the trend of Historical Volatility to see if there is any periodicity or trend. For example, volatility may increase during market instability and decrease during relatively stable periods.
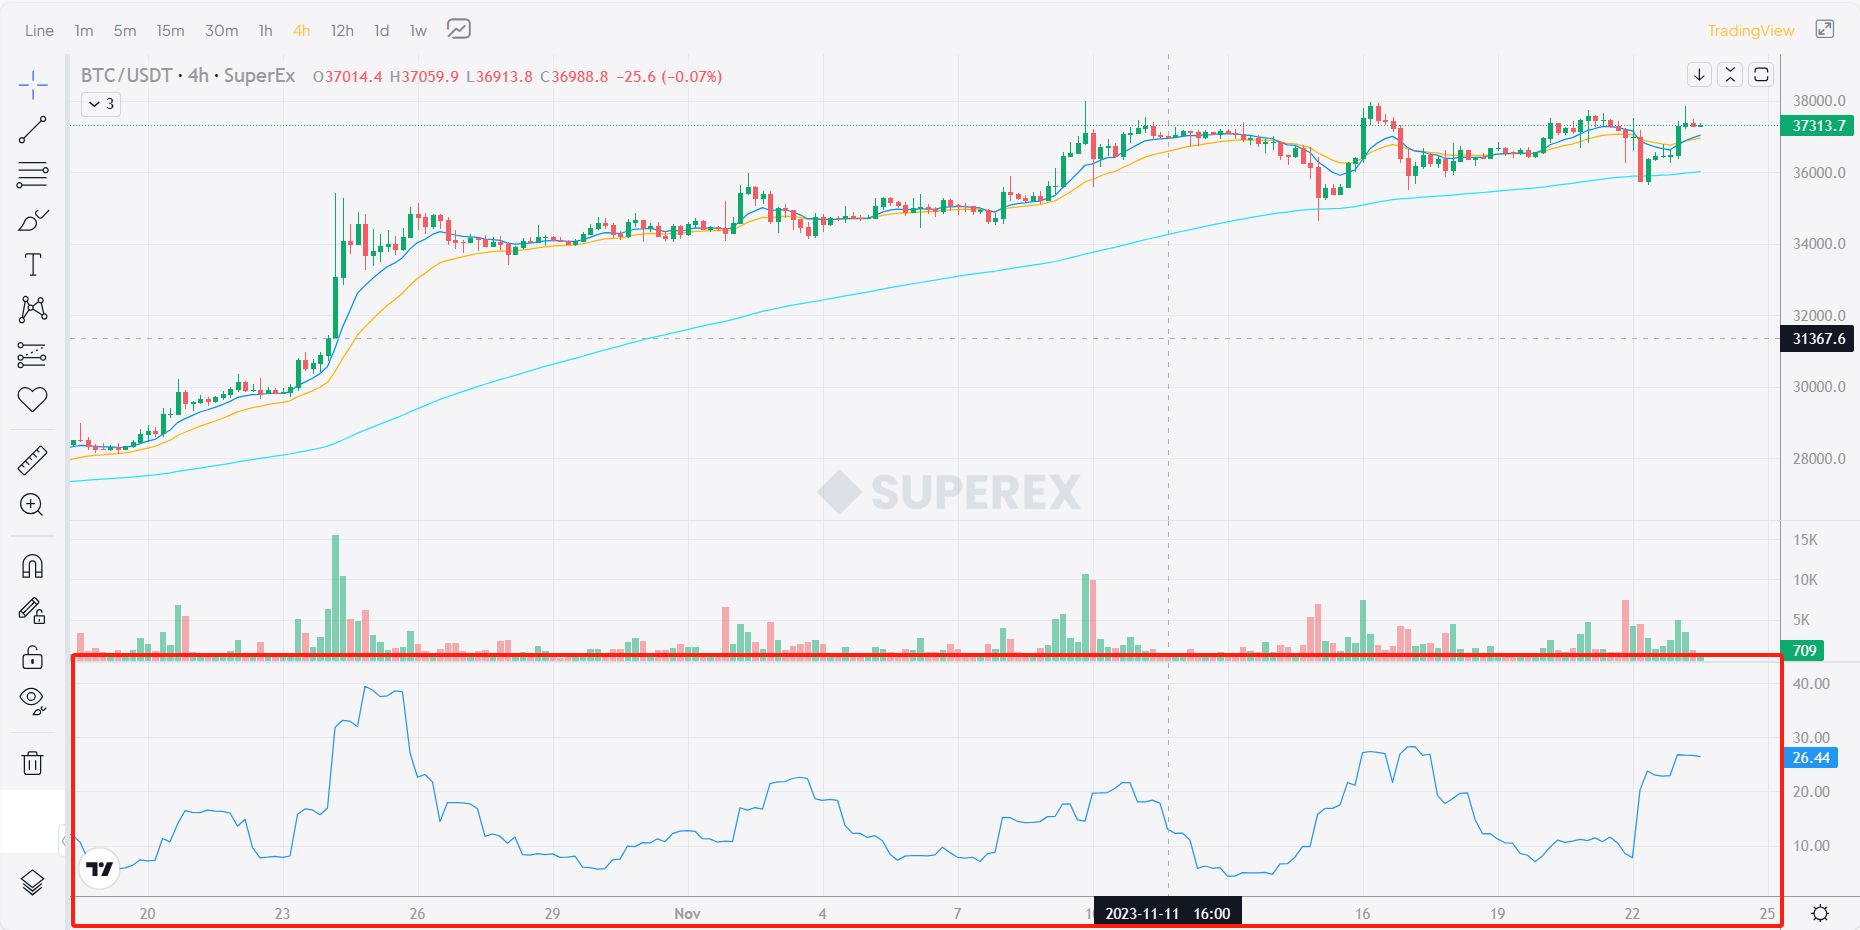
- Use Volatility Charts: By plotting a chart of Historical Volatility, one can more visually observe the trend of volatility. SuperEx has already drawn HISV indicator charts for users, allowing them to choose the appropriate chart period based on their investment timeframe. The HISV chart is shown in the red box in the diagram.
- Compare with Implied Volatility: Compare Historical Volatility with Implied Volatility to see if the market’s expectations for future volatility align with actual historical volatility. This is often used in the options market to determine if option prices are relatively overvalued or undervalued.
Additional Knowledge: Implied Volatility
Implied Volatility refers to the market’s estimation of future asset price volatility, inferred from the prices of options on the options market. Unlike Historical Volatility, which focuses on actual price fluctuations over a past period, Implied Volatility reflects market participants’ expectations of future volatility.
Main Features and Concepts:
- Inferred from Option Prices: Implied volatility is derived by solving for it in option pricing models. In addition to implied volatility, other factors in these models include the strike price of the option, the time remaining until expiration, the risk-free interest rate, and the current price of the asset. The market’s estimation of future volatility, or implied volatility, can be inferred from these known factors and the price of the option.
- Market Expectations: Implied volatility can be seen as the level of asset price fluctuation expected by market participants. A high implied volatility suggests that the market expects the asset price to fluctuate more significantly, while a low implied volatility indicates expectations of more stable prices.
- Influencing Factors: The level of implied volatility is influenced by various factors, including market sentiment, major events (such as company earnings reports, economic data releases, geopolitical events), and the buying and selling activities of option traders. Implied volatility often adjusts when market expectations change.
- Comparison with Historical Volatility: Investors often compare implied volatility with historical volatility. If implied volatility is higher than historical volatility, it may suggest greater uncertainty about the future. Conversely, if implied volatility is lower, it may indicate a cautious attitude towards future volatility.
- Application in Options Trading: Implied volatility plays a crucial role in options trading. Investors can identify overvalued or undervalued options by comparing implied volatility with actual market volatility, forming corresponding trading strategies.
Overall, implied volatility is a vital market indicator, providing investors with information about market expectations of future volatility, helping to better understand market sentiment and make informed investment decisions.
Summary
Although Historical Volatility is a useful tool, investors should be aware that it is calculated based on past data and only reflects historical price fluctuations. Therefore, when making decisions, investors should consider other factors, such as market expectations and news events, to gain a more comprehensive view of the market. The mention of Implied Volatility (IV) as another measure of volatility emphasizes the need for caution and a comprehensive approach when using Historical Volatility. Overall, the widespread application of Historical Volatility in financial markets reflects the importance investors place on rational decision-making and risk management.


IN-3-MINUTES@2x-1-1024x576.png)
Responses