LEARN PARABOLIC SAR IN 3 MINUTES – BLOCKCHAIN 101
Parabolic SAR, also known as “Stop and Reverse” or “Parabolic Indicator”, is a technical analysis indicator, which is widely used in the trading of stocks, foreign exchange, futures and other financial markets to help traders determine the reversal point of the trend.

Introduction to Parabolic SAR
Parabolic SAR(Stop and Reverse) index was put forward by American technical analyst J. Welles Wilder in 1978. This indicator was originally designed to help traders determine the price trend and the reversal point of the trend in the stock, futures and foreign exchange markets. At present, this index is widely used in technical analysis and trading strategy of stock and encryption market.
Parabolic SAR’s name “parabolic” comes from parabola, because the points of this indicator are arranged in an arc, which forms a parabola-like shape with the price trend. While “SAR” stands for “Stop and Reverse”, which indicates that when the indicator gives a reversal signal, the trader should stop the current trend trading and quickly reverse the trading.
The design concept of this indicator is that when the price goes up, the point will automatically move up by a certain step value, and when the price goes down, the point will move down. When the point moves from below the price to above the price, this is interpreted as a signal of trend reversal, and traders should consider selling. On the contrary, when the point moves from above the price to below the price, it indicates that there may be an upward trend, and traders should consider buying.
Main characteristics of Parabolic SAR
- Trend tracking: Parabolic SAR’s main goal is to track the price trend of assets. It automatically adjusts its position according to the price movement to adapt to the change of trend.
- Point identification: Parabolic SAR appears as a series of points on the price chart. The position of these points depends on the price trend. If the price goes up, the points will appear below the price, and vice versa.
- Inversion signal: the change of the position of Parabolic SAR can be used to identify the reversal of the trend. When the point jumps from below the price to above the price, it is regarded as a selling signal, indicating that a trend reversal may occur. On the contrary, if the price drops from above to below, it is regarded as a buying signal, indicating that there may be an upward trend.
- Risk management: Parabolic SAR can be used to determine the stop loss point. When the price trend is opposite to the direction indicated by Parabolic SAR, traders can set the stop loss to the position of the last point to reduce losses.
- Widely used: Parabolic SAR can be applied to charts of different markets and various time periods, making it a general tool for traders.
Parameter setting of Parabolic SAR
Parabolic SAR settings include two main parameters, namely Acceleration Factor and Maximum Value. These parameters determine the calculation method of Parabolic SAR points and the sensitivity of tracking trends.
- Acceleration Factor: The acceleration factor is a parameter that determines the point acceleration of Parabolic SAR. Its initial value is usually 0.02. The acceleration factor determines the moving speed of the point. With the continuation of the price trend, the acceleration factor will continue to increase and the distance between the point and the price will gradually expand. This will enable Parabolic SAR to track the fast moving trend more sensitively.
- Maximum Value: Extreme value is a parameter used to control the growth of acceleration factor. When the position of Parabolic SAR is close to the price, the extreme value will determine whether to increase the acceleration factor to accelerate the movement of the position. Usually, the initial setting of the extreme value is 0.20. Once the point exceeds this extreme value, the acceleration factor will stop increasing to stabilize the movement of the point.
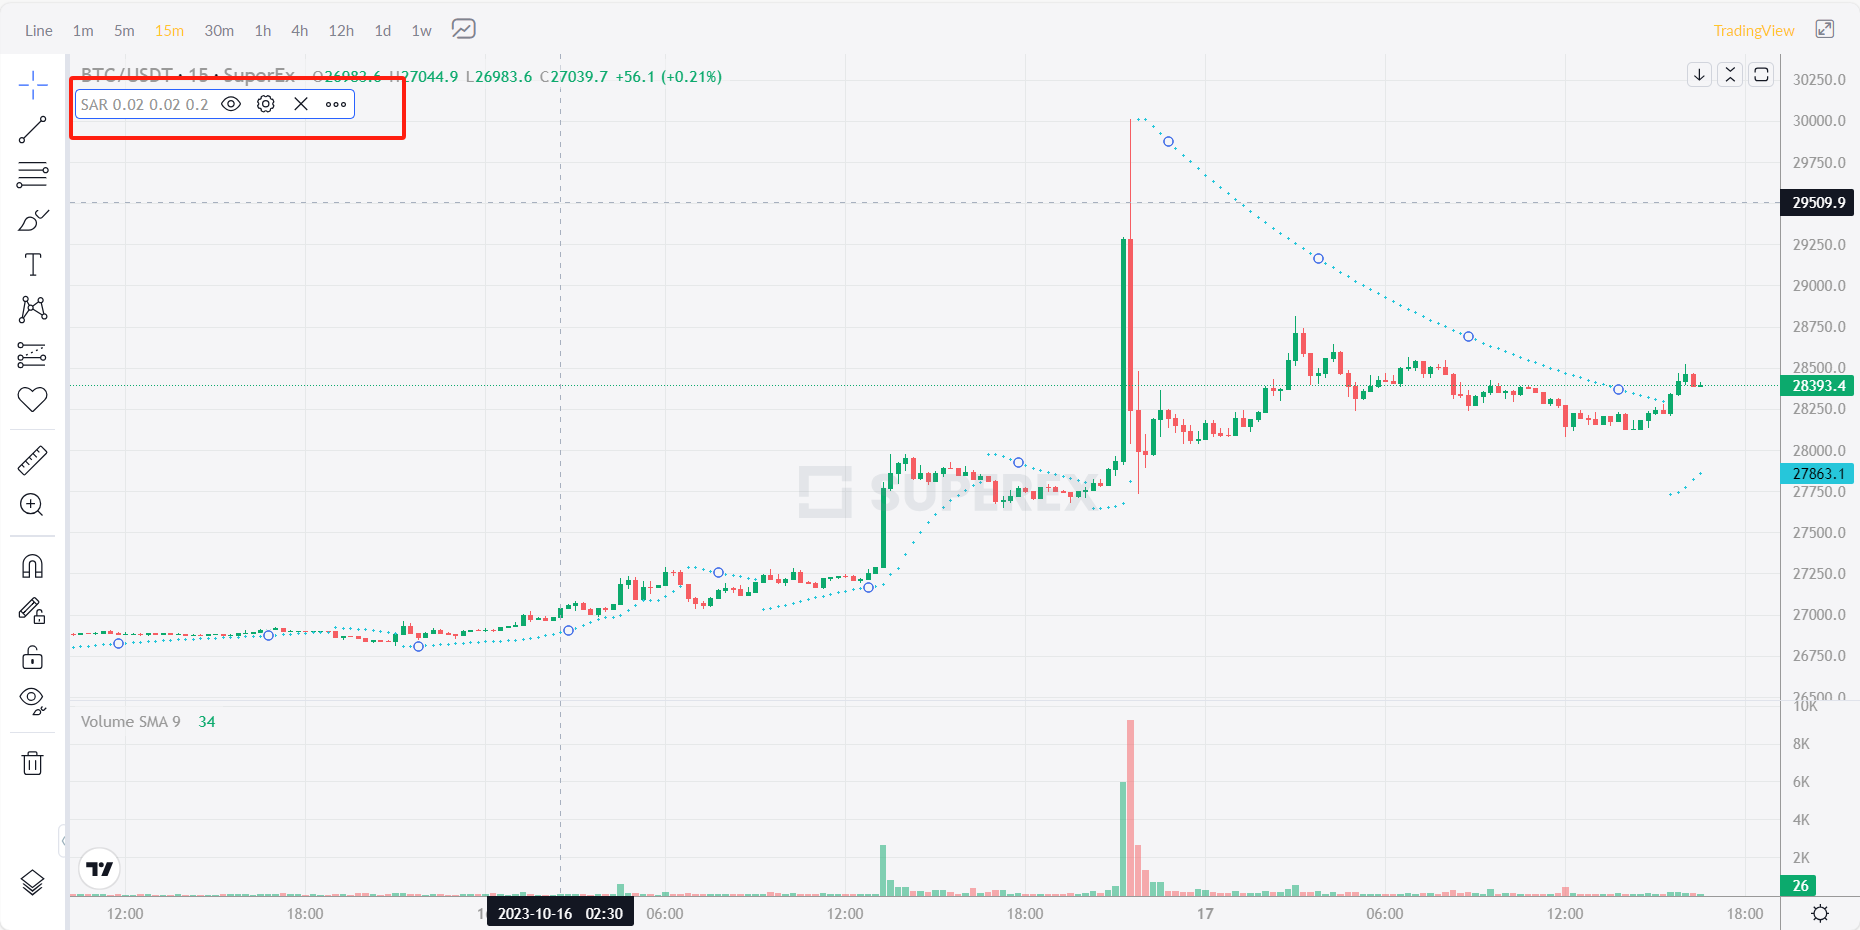
As shown below, in the SuperEx trading market, Parabolic SAR parameters have been automatically set, which is convenient for everyone to trade. If you want Parabolic SAR to track trends more sensitively, you can reduce the acceleration factor and extreme value; If you want more stable points, you can increase them.
Calculation formula of Parabolic SAR
Parabolic SAR(Stop and Reverse) is calculated as follows:
1.Initial point (SAR0):
SAR0 = EP – (AF * (EP – P0))
- EP: Initial extreme value, usually the highest price or the lowest price in the price chart, depending on the trend direction.
- AF: Initial acceleration factor, usually 0.02.
- P0: the point at the initial moment, usually 0.
2.the subsequent point (SARn):
SARn = SARn-1 + (AF * (EPn – SARn-1))
- SARn-1: the previous point.
- AF: Acceleration factor. With the movement of the point, AF will gradually increase, usually by 0.02, but not exceeding the maximum value (usually 0.20).
- EPn: A new extreme value, usually the highest or lowest price in the price chart, depending on the trend direction.
It should be noted that the calculation of SARn is based on the previous point (SARn-1) and the new extreme value (EPn). If the price trend does not reverse, the acceleration factor (AF) will gradually increase, thus making the point quickly approach the price. Once the price trend reverses, the point will move to the opposite direction of the price quickly, and AF will be reset to the initial value, and then gradually increase.
The actual operation of Parabolic SAR
We take BTC as an example to demonstrate the operation:
- Scenario: Suppose we use Parabolic SAR on the daily price chart of Bitcoin for transaction analysis.
- Initial setting: We use the default setting of Parabolic SAR, with the initial acceleration factor (AF) of 0.02 and the initial extreme value (Max AF) of 0.20.
- Trend analysis: We first observe the price chart to determine the current trend direction. If the Parabolic SAR point is below the price, it means that the trend is rising; If the point is above the price, it means that the trend is downward.
- Admission signal: Suppose we observe that the price trend is rising and the Parabolic SAR point is below the price. This means that the market is on the rise.
- Stop loss and profit: We can use Parabolic SAR to set stop loss and profit point. Since the trend is upward, we can take the last point as the stop loss point. If the point moves down and exceeds the price, it will be our stop loss point.
- Trading process: Based on our analysis, we decided to enter a long position (buy). We set the stop loss point below the last point to limit the potential loss. We can also set a profit target, which may be a certain price level or other technical indicators.
- Continuous monitoring: once we enter the transaction, we will continue to monitor the changes in the market and Parabolic SAR points. If the point starts to move upward, it is a positive sign that the upward trend may continue. We can consider adjusting the stop loss and profit point to protect the profit.
- Exit signal: If the position of Parabolic SAR moves from the bottom to the top, or other technical indicators provide a selling signal, we can consider withdrawing from the transaction and collecting profits.
This is just an example, and the actual operation needs careful and detailed analysis. At the same time, you should also consider the risk management strategy to ensure that your capital is fully protected. Combined with other technical indicators and market analysis methods, the accuracy of trading decisions can be improved.


Responses