LEARN MOMENTUM INDICATOR IN 3 MINUTES – BLOCKCHAIN 101
Guide
In the world of investment and trading, it is very important to analyze market trends and price dynamics. In order to help traders better understand the speed and direction of price change, Momentum Indicator is widely used in technical analysis. This paper will discuss the definition, function, practical operation method, case study and summarize its key role in trading.
Definition
Momentum index is a technical index, which is used to measure the changing speed of asset prices. It is based on a simple concept: prices will have inertia in the upward or downward trend. Momentum index measures this inertia by calculating the difference between the latest price and the price before a certain period of time. This indicator is usually presented in a single numerical form, which reflects the strength of price dynamics and whether the price may continue to move in the current direction.
Function
The role of momentum indicators mainly includes the following aspects:
Identify trends: momentum indicators can help traders identify the strength or weakness of market trends. If the momentum index is above the neutral line, it usually means that the price is rising more strongly, and vice versa.
Overbought and oversold conditions:
- Overbought condition: When the momentum index exceeds 0 (usually positive), it indicates that the market may be overheated and is considered as overbought condition.
- Oversold condition: when the momentum index is lower than 0 (usually negative), it means that the market may have oversold and is considered as oversold condition.
Intersection: The intersection of momentum indicator line and neutral line can be used to confirm the change of price trend. The intersection provides a signal to buy or sell.
Deviation: When the price hits a new high or a new low, but the momentum indicator does not follow, this may indicate that the trend is about to reverse, providing traders with an opportunity to adjust their strategies in time.
Practical operation method
The following steps are required for practical operation using momentum indicators:
- Time period selection: First, select a specific time period, such as 10 trading days, to calculate the momentum index.
- Calculate the difference: calculate the difference between the latest closing price (00:00 UTC) and the closing price before this time period to get the value of momentum index.
The calculation formula is usually M = current closing price-closing price n days ago, where n is the selected time period.
- Interpretation indicator: Interpret the value of the momentum indicator, and pay attention to whether it is in the overbought or oversold area, whether it is consistent with the price trend, and whether there is intersection or deviation.
Making trading strategies: According to the interpretation of momentum indicators, making appropriate trading strategies, including buying, selling or holding assets.
Case study
Let’s look at the application of momentum index through an actual case. Suppose you are a digital currency trader and are considering buying currencies. You chose 14 trading days to calculate the momentum index. As shown in the following figure, the selected area in the figure is the situation of SuperEx ecological token ET in the past 14 trading days.
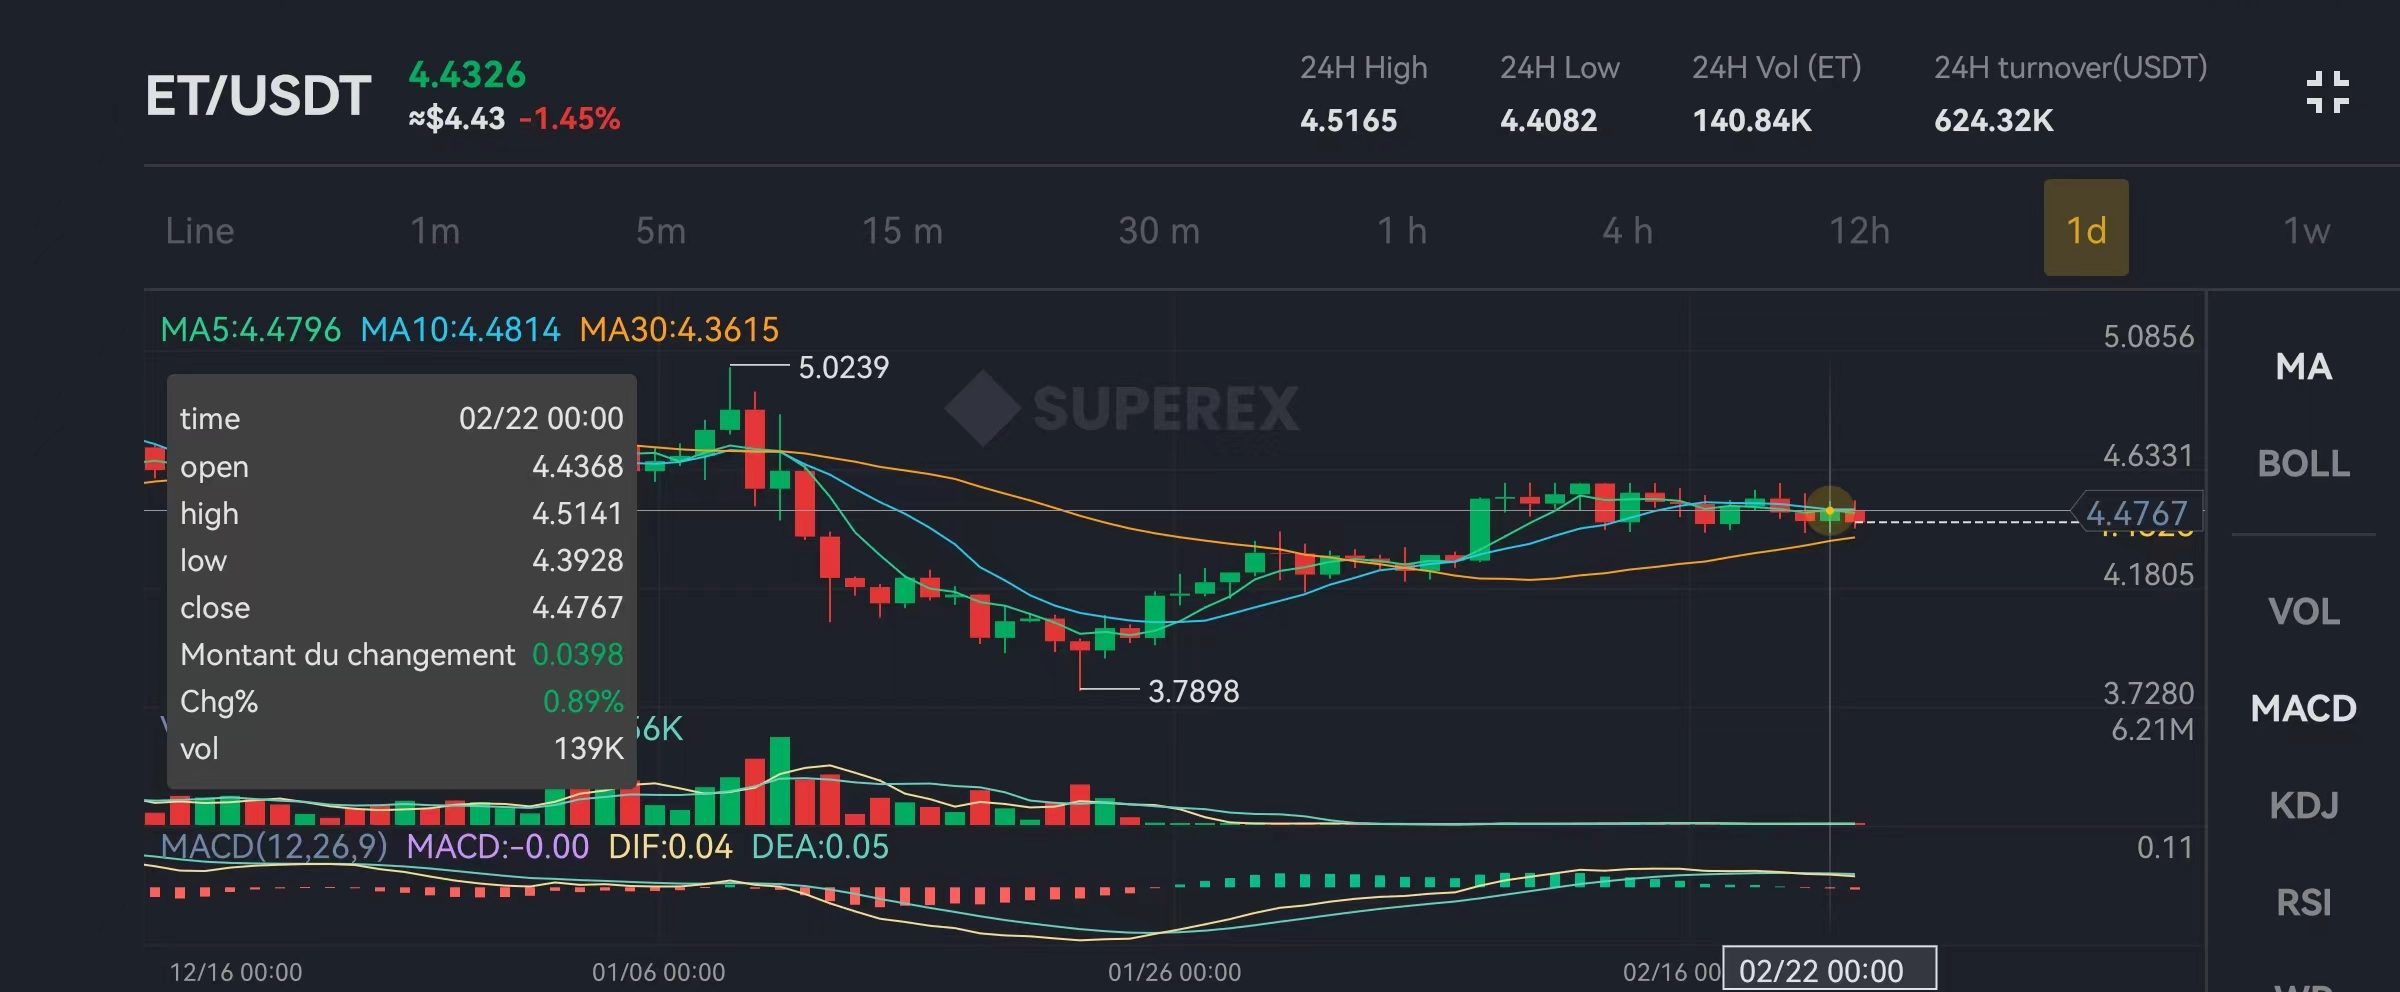
During the calculation, you found that the closing price on February 21st was $4.4698, and the closing price before 14 trading days was $4.2863. Therefore, the value of momentum index is $4.0454-$4.0066 = $0.1835 > 0.
You notice that the current value of momentum index is 0.0388, which is in the overbought area. The higher the value, the more serious the overbought. When the market is seriously overheated, it may reverse, while ET is less than 0.2, which belongs to the low overbought risk range.
The judgment of overbought or oversold should be combined with other technical indicators and market analysis, such as relative strength indicators (RSI) or random indicators, as well as observing price trends and support/resistance levels. These indicators are usually used to identify when the market may be overbought or oversold.
So, in the end, you should wait for some further confirmation signals instead of buying the coin immediately.
Summary
Momentum index is an important tool in technical analysis, which can help traders better understand price dynamics and market trends. Its functions include identifying trends, identifying overbought and oversold situations, and detecting intersections and deviations. However, as any technical index, momentum index also has its limitations and cannot be used for trading decisions alone. Successful trading needs to consider a variety of factors, including fundamentals, risk management and psychological factors. Therefore, traders should take momentum index as a part of analysis tools and combine it with other indicators and analysis methods to formulate more accurate trading strategies.


Responses