LEARN PARABOLIC SAR(PSAR) IN 3 MINUTES – BLOCKCHAIN 101

Prologue
Many people mistakenly believe that financial transactions and geometry belong to two completely unrelated categories. However, in technical indicators, geometry can also be used in technical analysis indicators. It is Parabolic Sar, a technical indicator built on geometric foundations that many traders enjoy using in trading.
Today, let’s talk about the “Parabolic SAR Index”, its operating principle, and how to use it in trading!

What is PSAR indicator
The Parabolic SAR indicator, abbreviated as PSAR, is developed by J Wells Wilder which was invented in the late 1970s. It is a leading technical indicator that displays the trend of market price changes, sending signals when determining price directions and price directions change. It was introduced in Wilder’s book “New Concepts of Technology Trading Systems” and other commonly used indicators, such as Relative Strength Index (RSI).
In fact, Wilder refers to this method as a parabolic time/price system, and the concept of SAR is as follows:
SAR indicates a stop and reversal. This is the point at which you exit a long trade and enter a short trade and vice versa.
——Wilder, JW, Jr. (1978).《New Concepts In Technical Trading Systems》
Nowadays, the PSAR indicator is used as a tool to identify market trends and potential reversal points. It displays the trend of market price changes and sends signals when determining the price direction and when there is a change in price direction. With this feature and predictive accuracy, the PSAR indicator is highly popular in the cryptocurrency trading market.
Wilder wants to find a system that can maximize profits from trend movements. He ultimately created the PSAR metric, which allows you to calculate the starting and ending points of new trends.
Meanwhile, PSAR does not attempt to guess the peak of motion. It tracks trend movements, allowing you to achieve maximum profit by gradually adjusting the stop profit position.
This indicator can be used for any trading tool in trend movements. However, developers do not recommend using this metric within a time frame of less than one hour. Furthermore, it is not recommended to use this indicator during a sideways period. During the consolidation period, the PSAR indicator will emit many false signals.
How to calculate the parabolic turning index
The algorithm uses two parabolic turning index formulas to calculate the parabolic turning index.
- The first formula is used for long positions (upward trend)
PSAR(i) = (HIGH(i-1) – PSAR(i-1)) * AF+PSAR(i-1)
- The second formula is used for short positions (downward trend)
PSAR(i) = (LOW(i-1) – PSAR(i-1)) * AF+PSAR(i-1)
Notes:
- PSAR is the parabolic turning indicator value. The indicator (i) represents the current value, and (i-1) represents the value of the previous cycle.
- HIGH is the highest price.
- LOW is the lowest price.
- AF is the acceleration factor. After reaching a new price extreme, the indicator value increases according to the step size set for each cycle. Wilder suggests using 0.02 as the initial factor, and for every new candle holder added, the AF value increases by 0.02 until reaching the maximum value of 0.2.
- AF formula
АF = 0,02 + ix*K
Notes:
- Ix is the cumulative number of cycles since the start of counting.
- K is the step size of price change, with a default value of 0.02.
How to use PSAR indicators for effective trading
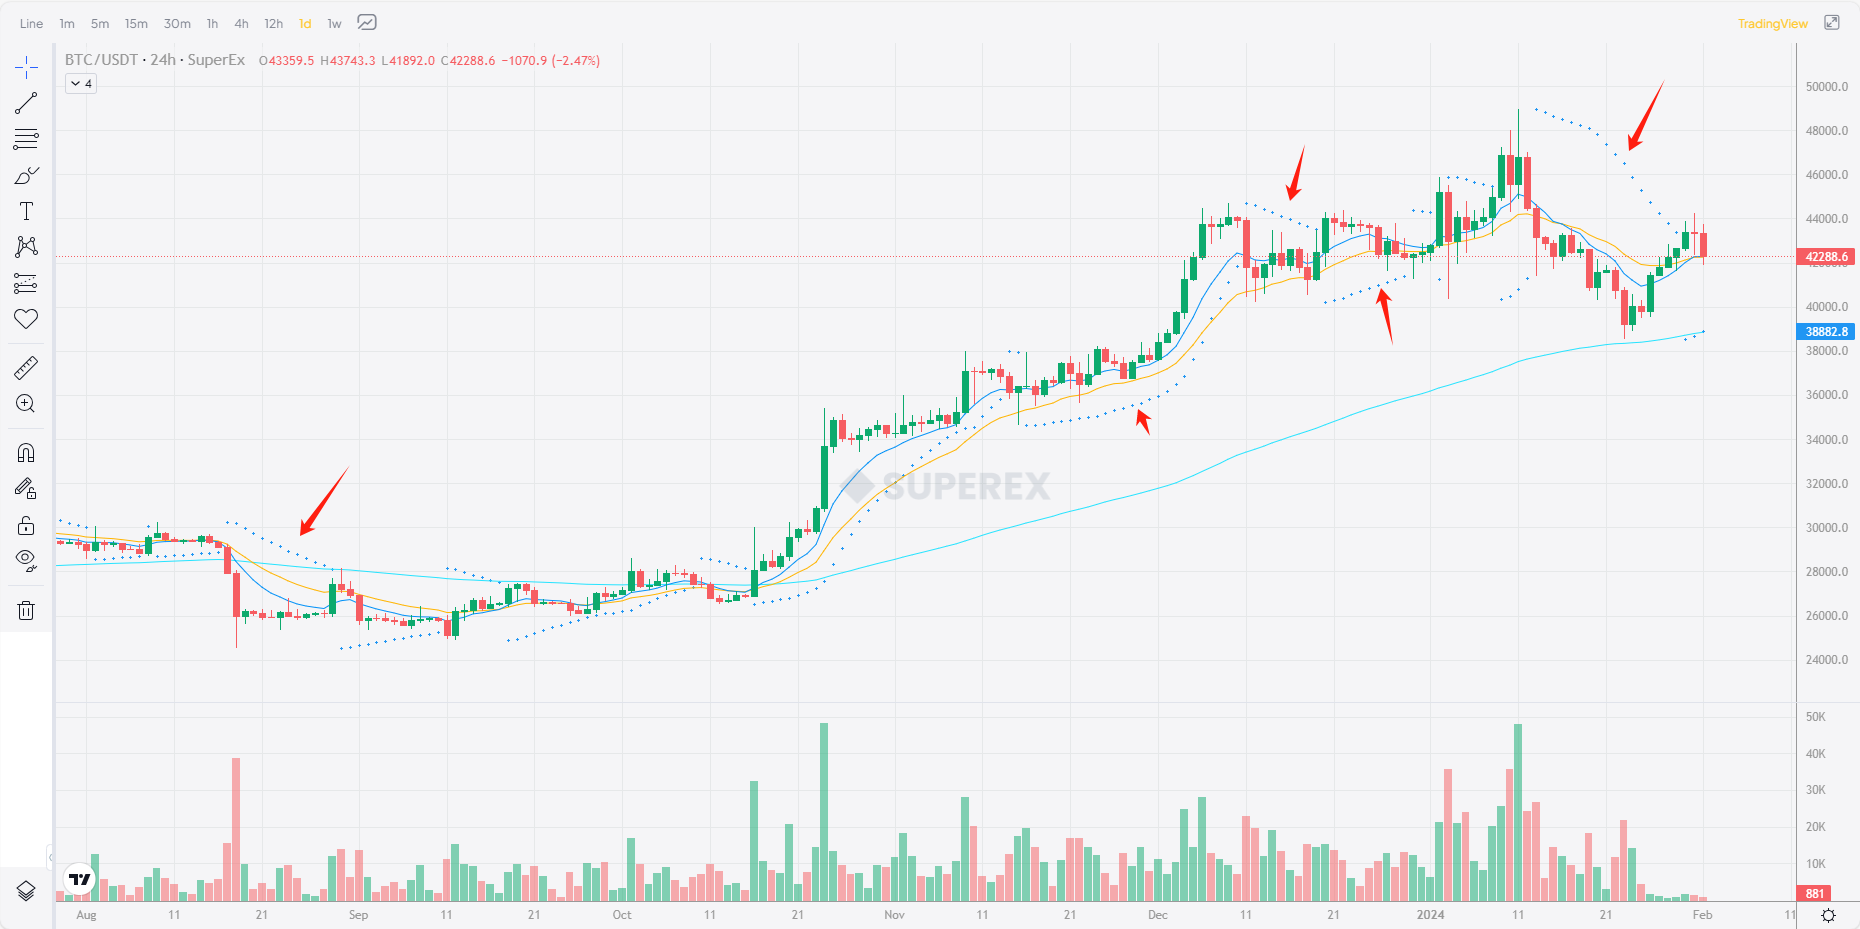
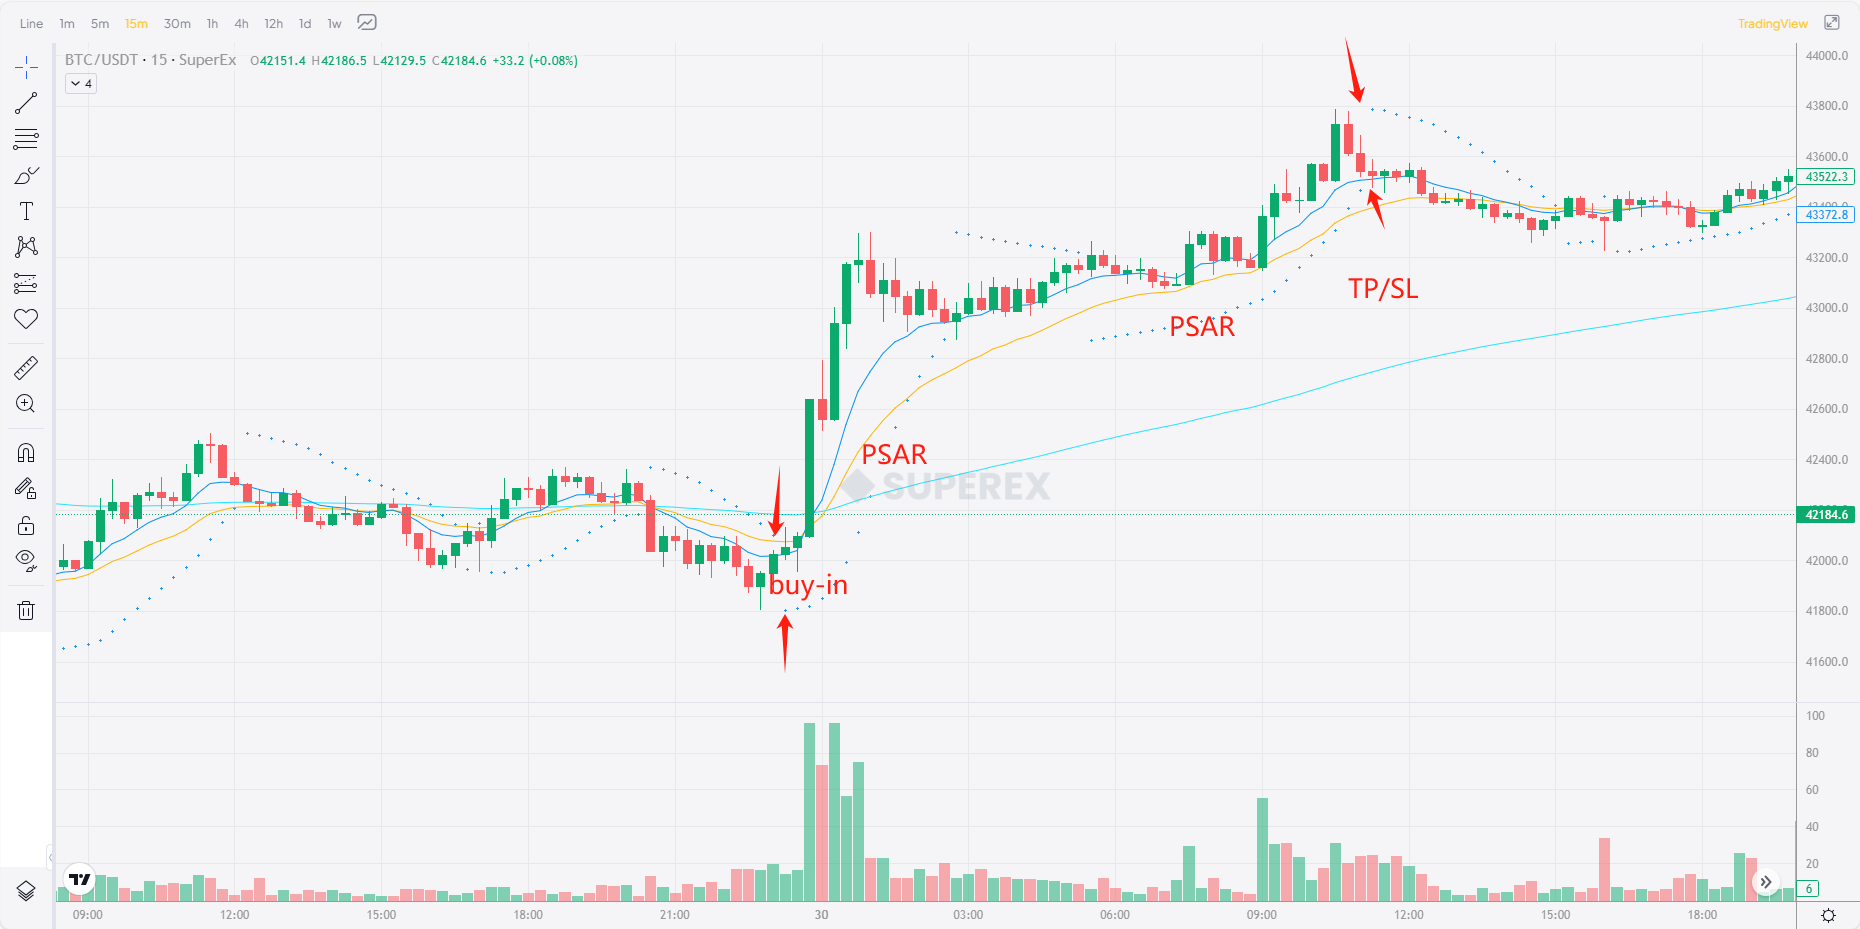
Let’s first learn the logic of using the PSAR indicator in one sentence: in an upward trend, the parabolic stop loss point is located below the price, while in a downward trend, it is located above the price. When the price crosses the parabolic stop loss point, it may indicate a reversal of the trend.
Simple understanding:
- When the price trend is in an upward trend, the PSAR indicator is located below the price. At this point, the intersection of PSAR and price is the trend reversal point, which is also our entry point and stop loss point.
- When the price trend is in a downward trend, the PSAR indicator is above the price. At this point, the intersection of PSAR and price is the trend reversal point, which is also our stop loss point and entry point.
This is an alternating cycle process, observing the intersection of PSAR and price can effectively make trend judgments, as shown in the following figure:
summary
No market analysis tool can guarantee 100% accuracy. Therefore, before using PSAR or any other strategy, investors should ensure that they have a good understanding of financial markets and technological analysis. They should also known the trading and risk management strategies to avoid inevitable risks.
Finally, because the PSAR indicator did not take into account trading volume, it did not provide much information about trend intensity.


… [Trackback]
[…] Find More on to that Topic: x.superex.com/academys/4033/ […]
… [Trackback]
[…] Read More on to that Topic: x.superex.com/academys/4033/ […]
… [Trackback]
[…] Info to that Topic: x.superex.com/academys/4033/ […]
… [Trackback]
[…] Find More Information here to that Topic: x.superex.com/academys/4033/ […]
… [Trackback]
[…] Find More Info here to that Topic: x.superex.com/academys/4033/ […]
… [Trackback]
[…] Find More Info here on that Topic: x.superex.com/academys/4033/ […]
… [Trackback]
[…] Read More on that Topic: x.superex.com/academys/4033/ […]
… [Trackback]
[…] Find More Info here on that Topic: x.superex.com/academys/4033/ […]
… [Trackback]
[…] Information on that Topic: x.superex.com/academys/4033/ […]
… [Trackback]
[…] Info on that Topic: x.superex.com/academys/4033/ […]
… [Trackback]
[…] Read More Information here on that Topic: x.superex.com/academys/4033/ […]
… [Trackback]
[…] Read More Info here to that Topic: x.superex.com/academys/4033/ […]
… [Trackback]
[…] Find More here to that Topic: x.superex.com/academys/4033/ […]
… [Trackback]
[…] Information on that Topic: x.superex.com/academys/4033/ […]
… [Trackback]
[…] Here you will find 18920 additional Information on that Topic: x.superex.com/academys/4033/ […]
… [Trackback]
[…] Find More Info here on that Topic: x.superex.com/academys/4033/ […]
… [Trackback]
[…] Read More Information here to that Topic: x.superex.com/academys/4033/ […]
… [Trackback]
[…] There you will find 18197 more Info to that Topic: x.superex.com/academys/4033/ […]
… [Trackback]
[…] Find More on on that Topic: x.superex.com/academys/4033/ […]
… [Trackback]
[…] Find More on on that Topic: x.superex.com/academys/4033/ […]
… [Trackback]
[…] Find More to that Topic: x.superex.com/academys/4033/ […]
… [Trackback]
[…] Find More Info here on that Topic: x.superex.com/academys/4033/ […]
… [Trackback]
[…] Find More on to that Topic: x.superex.com/academys/4033/ […]
… [Trackback]
[…] Here you can find 71290 more Info on that Topic: x.superex.com/academys/4033/ […]