LEARN ACC/DIST OSCILLATOR INDEX IN 3 MINUTES ——BLOCKCHAIN 101

SuperEx Academy is the world’s first online academy to offer comprehensive education on crypto-native indicators. It features the most extensive technical indicator tutorials and is the most detailed online learning platform for market technical analysis. Here, you’ll find hundreds of courses on commonly used indicators, along with nearly every known crypto-native indicator tutorial.
In traditional technical analysis, price is often treated as the ultimate source of truth. But in real markets—especially crypto—price alone rarely tells the full story. Behind every price movement lies an invisible force: capital flow. The Accumulation/Distribution Oscillator (ACC/DIST) was created to measure exactly that.
Rather than asking “Where is price going?”, ACC/DIST asks a deeper question: Is capital quietly flowing into this asset, or silently exiting it?
This distinction is crucial in crypto markets, where liquidity can shift rapidly, narratives rotate fast, and large holders often act long before price reflects their intentions.
- Click to register SuperEx
- Click to download the SuperEx APP
- Click to enter SuperEx CMC
- Click to enter SuperEx DAO Academy — Space

What Is the Accumulation/Distribution Oscillator
The Accumulation/Distribution Oscillator—often abbreviated as A/D or ACC/DIST—is a volume-based indicator designed to track whether an asset is being accumulated (bought) or distributed (sold) over time.
Unlike indicators that focus purely on momentum or trend strength, ACC/DIST combines price location within a candle and trading volume to infer buying and selling pressure.
At its core, the logic is simple:
- If price closes near the top of its range on high volume, buyers are in control → accumulation
- If price closes near the bottom of its range on high volume, sellers dominate → distribution
Instead of reacting to short-term volatility, the indicator builds a cumulative line, revealing long-term capital behavior.
Why ACC/DIST Matters in Crypto Markets
Crypto markets behave very differently from traditional equities:
- There is no centralized order book across venues
- Large holders (“whales”) can significantly influence price
- Liquidity fragmentation across exchanges is common
- Narrative-driven pumps often precede real adoption
In such an environment, volume-based confirmation becomes more valuable than price signals alone.
ACC/DIST is especially useful because:
- It can detect smart money positioning before price breaks out
- It helps differentiate healthy rallies from low-quality pumps
- It reveals hidden distribution during sideways or rising markets
- It works across spot, perpetuals, and index-based instruments
In short, ACC/DIST is less about timing entries precisely and more about understanding who is in control of the market.
How ACC/DIST Is Calculated (Conceptual Understanding)
You don’t need to compute ACC/DIST manually, but understanding the logic behind it helps avoid misuse.
The indicator relies on two key components:
1. Close Location Value (CLV)
CLV measures where the closing price sits within the candle range:
- Close near high → bullish pressure
- Close near low → bearish pressure
Mathematically, it assigns a value between -1 and +1.
2. Volume Weighting
That CLV value is multiplied by the candle’s volume, meaning:
- Strong moves on high volume matter more
- Weak moves on low volume matter less
The result is then added cumulatively to form the ACC/DIST line.
This cumulative nature is critical: ACC/DIST is not about single candles—it’s about persistent behavior over time.
How to Read the ACC/DIST Line
ACC/DIST does not oscillate between fixed bounds like RSI or Stochastic. Instead, it forms a flowing line that trends upward or downward.
Basic Interpretations
- Rising ACC/DIST → Net accumulation
- Falling ACC/DIST → Net distribution
- Flat ACC/DIST → Balance between buyers and sellers
But the real power lies not in absolute direction—it lies in divergence.
Bullish and Bearish Divergences Explained
1. Bullish Divergence
Occurs when:
- Price makes lower lows
- ACC/DIST makes higher lows
This suggests that despite falling prices, selling pressure is weakening and accumulation is taking place under the surface.
In crypto, bullish divergence often appears:
- During prolonged consolidation
- Near macro bottoms
- Before narrative rotations
It does not guarantee immediate reversal—but it significantly improves probabilistic bias.
2. Bearish Divergence
Occurs when:
- Price makes higher highs
- ACC/DIST makes lower highs
This signals that price is rising on diminishing capital support, often a sign of distribution by informed participants.
In bull markets, this frequently precedes:
- Sharp pullbacks
- Failed breakouts
- Liquidity traps
ACC/DIST divergence is especially valuable because it can reveal distribution even while price looks strong.
ACC/DIST vs On-Balance Volume (OBV)
ACC/DIST is often compared to OBV, but they differ in important ways:
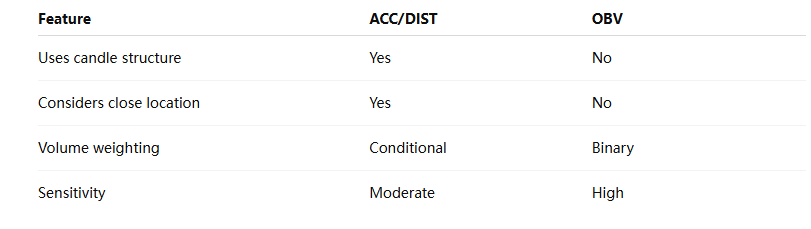
OBV assigns all volume as bullish or bearish based solely on whether price closes up or down. ACC/DIST is more nuanced—it evaluates how price closed.
For crypto markets with frequent wicks and volatility, ACC/DIST often produces cleaner signals.
Common Use Cases in Trading
1. Trend Confirmation
- If price trends upward and ACC/DIST trends upward, the move is structurally supported.
- If price rises but ACC/DIST flattens or falls, caution is warranted.
2. Breakout Validation
Before major breakouts:
- ACC/DIST often starts rising early
- Accumulation appears before volatility expansion
False breakouts often occur when price breaks resistance without ACC/DIST confirmation.
3. Market Phase Identification
ACC/DIST helps distinguish:
- Accumulation phases
- Distribution phases
- Transitional chop
This is especially useful for longer-term positioning rather than short-term scalping.
Limitations and Common Misinterpretations
ACC/DIST is powerful, but it is not infallible.
1. Key Limitations
- Sensitive to inaccurate volume data
- Less effective in extremely low-liquidity assets
- Can lag during sudden news-driven moves
2. Common Mistakes
- Treating ACC/DIST like a timing oscillator
- Ignoring market context
- Using it alone without structure or trend analysis
ACC/DIST is best used as a confirmation tool, not a standalone strategy.
ACC/DIST in the Context of Crypto-Native Indicators
Crypto-native markets introduce dynamics absent in traditional finance:
- Perpetual funding
- Open interest expansion
- Cross-exchange arbitrage
- On-chain capital flows
ACC/DIST complements crypto-native indicators by:
- Confirming whether leverage-driven moves are supported by spot demand
- Identifying accumulation during funding-neutral phases
- Detecting early distribution before OI collapses
In modern crypto analysis, volume is behavior, and ACC/DIST remains one of the cleanest lenses through which to observe it.
Final Thoughts
The Accumulation/Distribution Oscillator is not flashy. It doesn’t promise instant entries or precise exits. But what it offers is arguably more valuable: Insight into who is actually committing capital.
In a market where narratives change fast and volatility is constant, understanding accumulation and distribution gives traders an edge that price alone cannot provide.
Mastering ACC/DIST is not about speed—it’s about clarity. And clarity, in crypto markets, is often the difference between reacting late and positioning early.


Responses