LEARN RSI OF MOVING AVERAGE INDEX IN 3 MINUTES ——BLOCKCHAIN 101

Have you noticed that most commonly used technical indicators actually belong to one giant “RSI family”? That’s right. Even though we have already covered many evolved versions of RSI-based indicators, today’s topic is still part of the RSI family — RSI of Moving Average.
In technical analysis, there is a category of indicators that are inherently “awkward.” They are not simply telling you the trend direction, nor are they only indicating whether market sentiment is overheated. Instead, they attempt to solve a more realistic question:In a trend, when should you chase?When should you stop?And when should you start being alert to a reversal?
RSI of Moving Average (abbreviated as MA-RSI) is a typical representative of this category. It is not a new invention, but in range-to-trend markets, the middle-to-late stages of bull markets, and downtrend rebound phases, it is often more practical than using RSI or a moving average alone.
In this article, we will not talk about formulas or academic derivations. We will only answer three questions:
-
What exactly is RSI of Moving Average looking at?
-
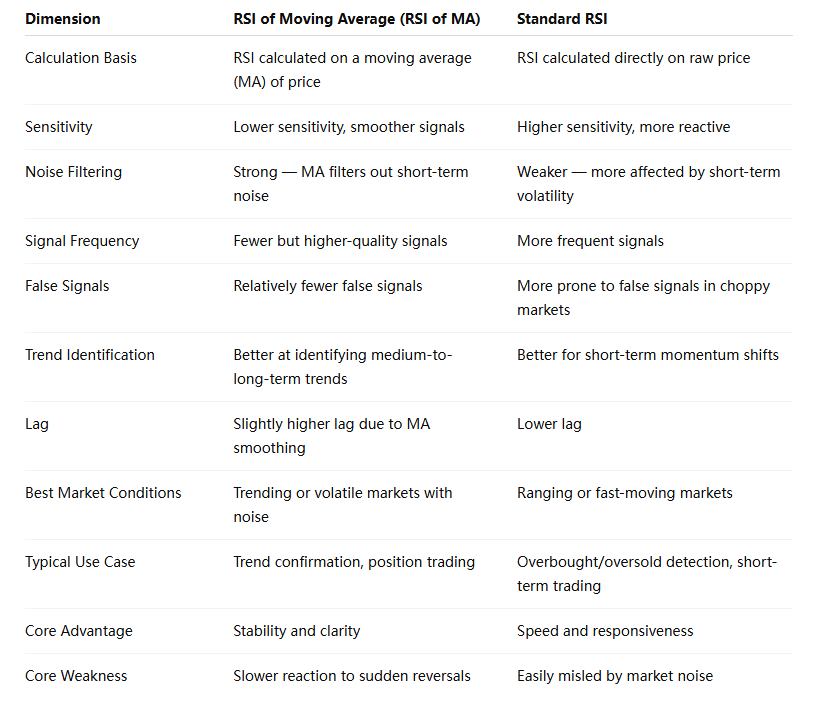
What is its fundamental difference from the standard RSI?
-
In real trading, when is it actually useful?
First, why does “RSI alone” so often fail?
We have mentioned this issue in previous articles about RSI and its evolved indicators. Today, let’s answer it systematically. First, the conclusion:The biggest problem with RSI is not that it’s inaccurate, but that it is too “emotional.”
The core logic of RSI can be summarized in one sentence:
-
Rising fast → strength
-
Rising too fast → overheating
-
Falling too fast → panic
The problem is — the market does not always move in a linear way.
1. In trending markets, RSI becomes “blunted”
You have definitely seen this scenario: a bull market starts, RSI quickly surges to 70 or 80 and then stays there for a long time, while price continues making higher highs. At this point, if you only look at RSI:
-
You will constantly think “a pullback is coming”
-
You will repeatedly miss the trend
-
You might even end up shorting the market
RSI is not good at describing trend persistence.
2. In ranging markets, RSI becomes overly sensitive
On the other hand, during sideways consolidation, RSI oscillates back and forth between 30 and 70. Buy and sell signals become extremely frequent. It looks great on charts, right?But in live trading, you often get repeatedly whipsawed.
This is exactly why RSI needs a “trend filter.”Previous RSI evolution versions were all about adding filters to RSI — and RSI of Moving Average is no exception.
3. RSI of Moving Average: what exactly does it do?
The idea behind RSI of MA is very simple, but very “smart”:Instead of calculating RSI directly on price, it first smooths price — and then calculates RSI on that result.
In other words:
-
Step 1: Price → Moving Average (MA)
-
Step 2: Moving Average → RSI
You can understand it with one sentence:“I don’t care about price noise; I only care about emotional changes within the trend.”
Why is “MA first, RSI second” so important?
The essence of a moving average is a time-based filter. Whether it’s MA, EMA, or WMA, they all do one thing: reduce the interference of short-term fluctuations.
When you change RSI’s input from “price” to “moving average”:
-
Small-timeframe fluctuations are weakened
-
RSI no longer reacts to every single candlestick
-
Emotional changes become slower — but much more stable
MA-RSI describes “trend emotion,” not “price emotion.”
-
Standard RSI answers:“Are these recent candles rising or falling fast?”
-
MA-RSI answers:“Is the strength of this trend accelerating or decaying?”
This is its core value.
Now let’s move to real-world usage
Use Case 1: Is the trend still “alive”?
In trending markets, MA-RSI has a very practical rule: If MA-RSI stays above 50 for a prolonged period, it indicates:
-
The moving average itself is rising
-
The upward rhythm remains healthy
-
The trend has not failed
Even if price pulls back, as long as MA-RSI does not break below 50 or quickly recovers, the trend remains valid.
Many experienced traders use this specifically for:
-
Position-holding confidence
-
Preventing premature profit-taking
Use Case 2: Distinguishing “trend pullback” vs “trend reversal”
This is the most underestimated value of MA-RSI.
Scenario A: Pullback
-
Price declines
-
MA-RSI pulls back from high levels
-
MA-RSI stabilizes in the 40–50 zone → This is most likely just a technical retracement within the trend.
Scenario B: Reversal
-
MA-RSI clearly breaks below 50
-
Multiple rebound attempts fail
-
High points keep moving lower → The trend structure is starting to loosen.
What MA-RSI gives you is a signal of trend emotion breakdown, not single-candlestick volatility.
Use Case 3: Filtering false breakouts and false overbought signals
Standard RSI often behaves like this:
-
Price spikes briefly
-
RSI instantly jumps above 70
-
Then immediately collapses
MA-RSI rarely does this.
Because:
-
A moving average cannot spike instantly
-
RSI of MA requires sustained trend pressure to rise
Therefore, MA-RSI overbought conditions are often far more meaningful than RSI overbought conditions.
Final takeaway in one sentence
RSI of Moving Average is not used to predict price — it is used to judge whether a trend is still worth betting on.
It does not tell you:
-
Where the bottom is
-
Where the top is
But it does tell you:
-
Whether this move is still healthy
-
Whether pullbacks are opportunities
-
Whether sentiment is starting to deteriorate
In a market that is increasingly biased toward trend-based and structure-driven trading, MA-RSI may not be the flashiest indicator — but it is often the most durable one.
If you are already tired of being repeatedly “tricked in and out” by RSI, then it may be time to let it slow down — and start behaving more like a trader who truly understands trends.


Responses