LEARN ULCER INDEX IN 3 MINUTES ——BLOCKCHAIN 101
SuperEx Academy is the world’s first online academy to offer comprehensive education on crypto-native indicators. It features the most extensive technical indicator tutorials and is the most detailed online learning platform for market technical analysis. Here, you’ll find hundreds of courses on commonly used indicators, along with nearly every known crypto-native indicator tutorial.
Today, we’re going to learn about the Ulcer Index (UI) — a metric designed to measure the kind of risk that causes anxiety, heartache, and sleepless nights during investing.
In other words, the UI reflects the level of “investor pain” experienced throughout the investment process.
Let’s take just three minutes to understand and master the Ulcer Index (UI) — how it works and what it tells us about the emotional side of market risk.
- Click to register SuperEx
- Click to download the SuperEx APP
- Click to enter SuperEx CMC
- Click to enter SuperEx DAO Academy — Space

What Is the Ulcer Index (UI)?
In most technical analysis tools, volatility is treated symmetrically — prices go up or down, and both movements increase the “risk score.”But in reality, investors don’t feel ulcers when prices rise — they get ulcers when prices fall.
That’s exactly why the Ulcer Index was born.
The Ulcer Index (UI) is a downside risk indicator that measures the depth and duration of price declines from recent highs.It doesn’t punish upside volatility — only the drawdowns that cause stress.
It was created in 1987 by Peter Martin and Byron McCann, primarily to evaluate mutual funds’ “investor pain level.”In the world of crypto — where emotions run hotter and markets never sleep — the Ulcer Index feels almost tailor-made for modern traders.
Why the Ulcer Index Matters
Most crypto investors look at metrics like Standard Deviation, ATR, or Sharpe Ratio to understand volatility.But these traditional tools have a flaw: they treat all price movements as equal.
In reality:
- A 30% pump feels exciting.
- A 30% dump feels devastating.
So if you want to measure emotional risk — how hard it is to “HODL” through drawdowns — the Ulcer Index gives a far more human measure of volatility.
It answers the question:“How stressful has it been to hold this asset?”
The Formula (and What It Really Means)
Let’s unpack it again, step by step:
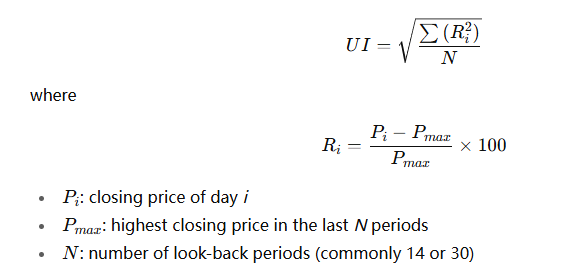
In plain English:
Identify the most recent high.
- Measure how far each day’s price has fallen from that peak (as a percentage).
- Square each result to emphasize deeper drawdowns.
- Average them across the time period.
- Take the square root — this gives the Ulcer Index.
- Higher UI = deeper and longer drawdowns → higher stress.
- Lower UI = smoother price action → lower stress.
Interpreting Ulcer Index Levels
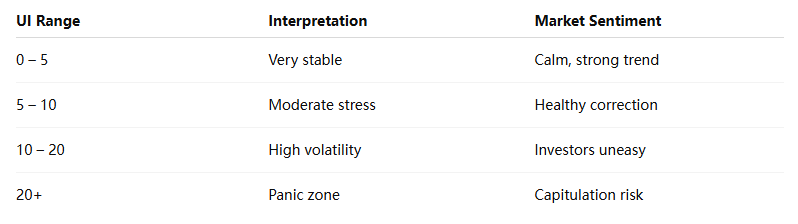
For crypto traders, anything above 15 often indicates turbulent or bear market conditions.If the UI begins to fall again, it usually suggests that prices are stabilizing and fear is subsiding — a possible accumulation phase.
Real-World Uses in Crypto Trading
- Portfolio Risk Evaluation
Use UI to compare tokens with similar returns.Two assets might both yield +30%, but if one has a UI of 8 and the other 18, the first one gave smoother performance — ideal for long-term holders or institutional investors.
- Market Sentiment Tracking
- A rising UI across major coins (BTC, ETH, SOL) can indicate growing fear or distribution.
- A falling UI means traders are regaining confidence and volatility is easing.
- Combine with Momentum Indicators
When UI decreases while RSI or MACD turns bullish, it often signals a calm bottom — traders are no longer panic-selling, and trend reversal may be near.
- Strategy Optimization
Many algorithmic traders use UI as a filter:
- Only enter trades when UI < 10 (stable trend)
- Exit or reduce exposure when UI > 20 (excessive drawdown stress).
This helps avoid the emotional traps of over-trading during volatile periods.
Advanced Use: The Martin Ratio
The Ulcer Index becomes even more powerful when paired with the Martin Ratio, which is similar to the Sharpe Ratio but uses UI as its risk denominator:MartinRatio =(AverageReturn−RiskFreeRate )/Ulcer Index
This helps traders evaluate returns relative to the emotional pain endured to achieve them.
Higher Martin Ratio = better risk-adjusted performance with less ulcer-inducing volatility.
In crypto portfolios, assets with a lower UI but decent returns tend to produce higher Martin Ratios, indicating sustainable, calmer gains.
Why It Fits the Crypto Era
Crypto markets are open 24/7, highly sentiment-driven, and prone to rapid hype cycles.
That makes emotional management just as crucial as technical skill.
The Ulcer Index offers something most indicators don’t:a quantitative way to measure how comfortable it feels to hold an asset.
In a world where FOMO and fear often dominate decision-making, this metric gives traders a way to identify assets that are less psychologically taxing, yet still profitable.
For institutions entering Web3 — hedge funds, DAOs, or treasury managers — UI can become part of risk dashboards, helping allocate capital to tokens with more stable behavioral profiles.
Pro Tips for Using UI
- Use a longer period (30–60 days) for long-term trend analysis; shorter periods (7–14 days) for active trading.
- Combine it with volume analysis — low UI and rising volume can confirm strong accumulation phases.
- Track rolling UI averages — a consistent decline signals a maturing bull market.
- Compare UI across assets to find calmer alternatives for diversification.
In Short
- Ulcer Index = how painful the drawdowns feel.
- Focuses purely on downside risk, not total volatility.
- Lower UI = calmer holding experience.
- Essential for long-term crypto investors and institutional risk managers.
In crypto trading, success isn’t just about who earns more — it’s about who survives longer.Understanding your Ulcer Index helps you stay rational, balanced, and ready for the next opportunity.


Responses