LEARN FISHER TRANSFORM INDEX IN 3 MINUTES — BLOCKCHAIN 101
SuperEx Academy is the world’s first online academy to offer comprehensive education on crypto-native indicators. It features the most extensive technical indicator tutorials and is the most detailed online learning platform for market technical analysis. Here, you’ll find hundreds of courses on commonly used indicators, along with nearly every known crypto-native indicator tutorial.
Today’s lesson covers the Fisher Transform, a specialty indicator for spotting extremes (overbought/oversold) introduced by John F. Ehlers in the late 1990s.
Ehlers gave a full treatment of the Fisher Transform—and demonstrated its real-world performance in FX, equities, and futures—in his 2002 book Cybernetic Analysis for Stocks and Futures.
Side note: Why is it called the “Fisher Transform”?
The name comes from statistician Ronald A. Fisher, who proposed a mathematical transform that converts skewed distributions into something closer to a normal distribution. Ehlers borrowed this idea and applied it to price series to smooth data and extract extremes.
- Click to register SuperEx
- Click to download the SuperEx APP
- Click to enter SuperEx CMC
- Click to enter SuperEx DAO Academy — Space
![]()
What is the Fisher Transform?
The core objective of the Fisher Transform is to map price action into an approximately normal distribution, making turning points easier to see.
In both traditional and crypto markets, price distributions are often irregular, highly volatile, and heavy-tailed, which makes conventional indicators struggle with timely reversal detection. By “normalizing” prices, the Fisher Transform magnifies extremes, so potential inflection points stand out and trading signals arrive sooner.
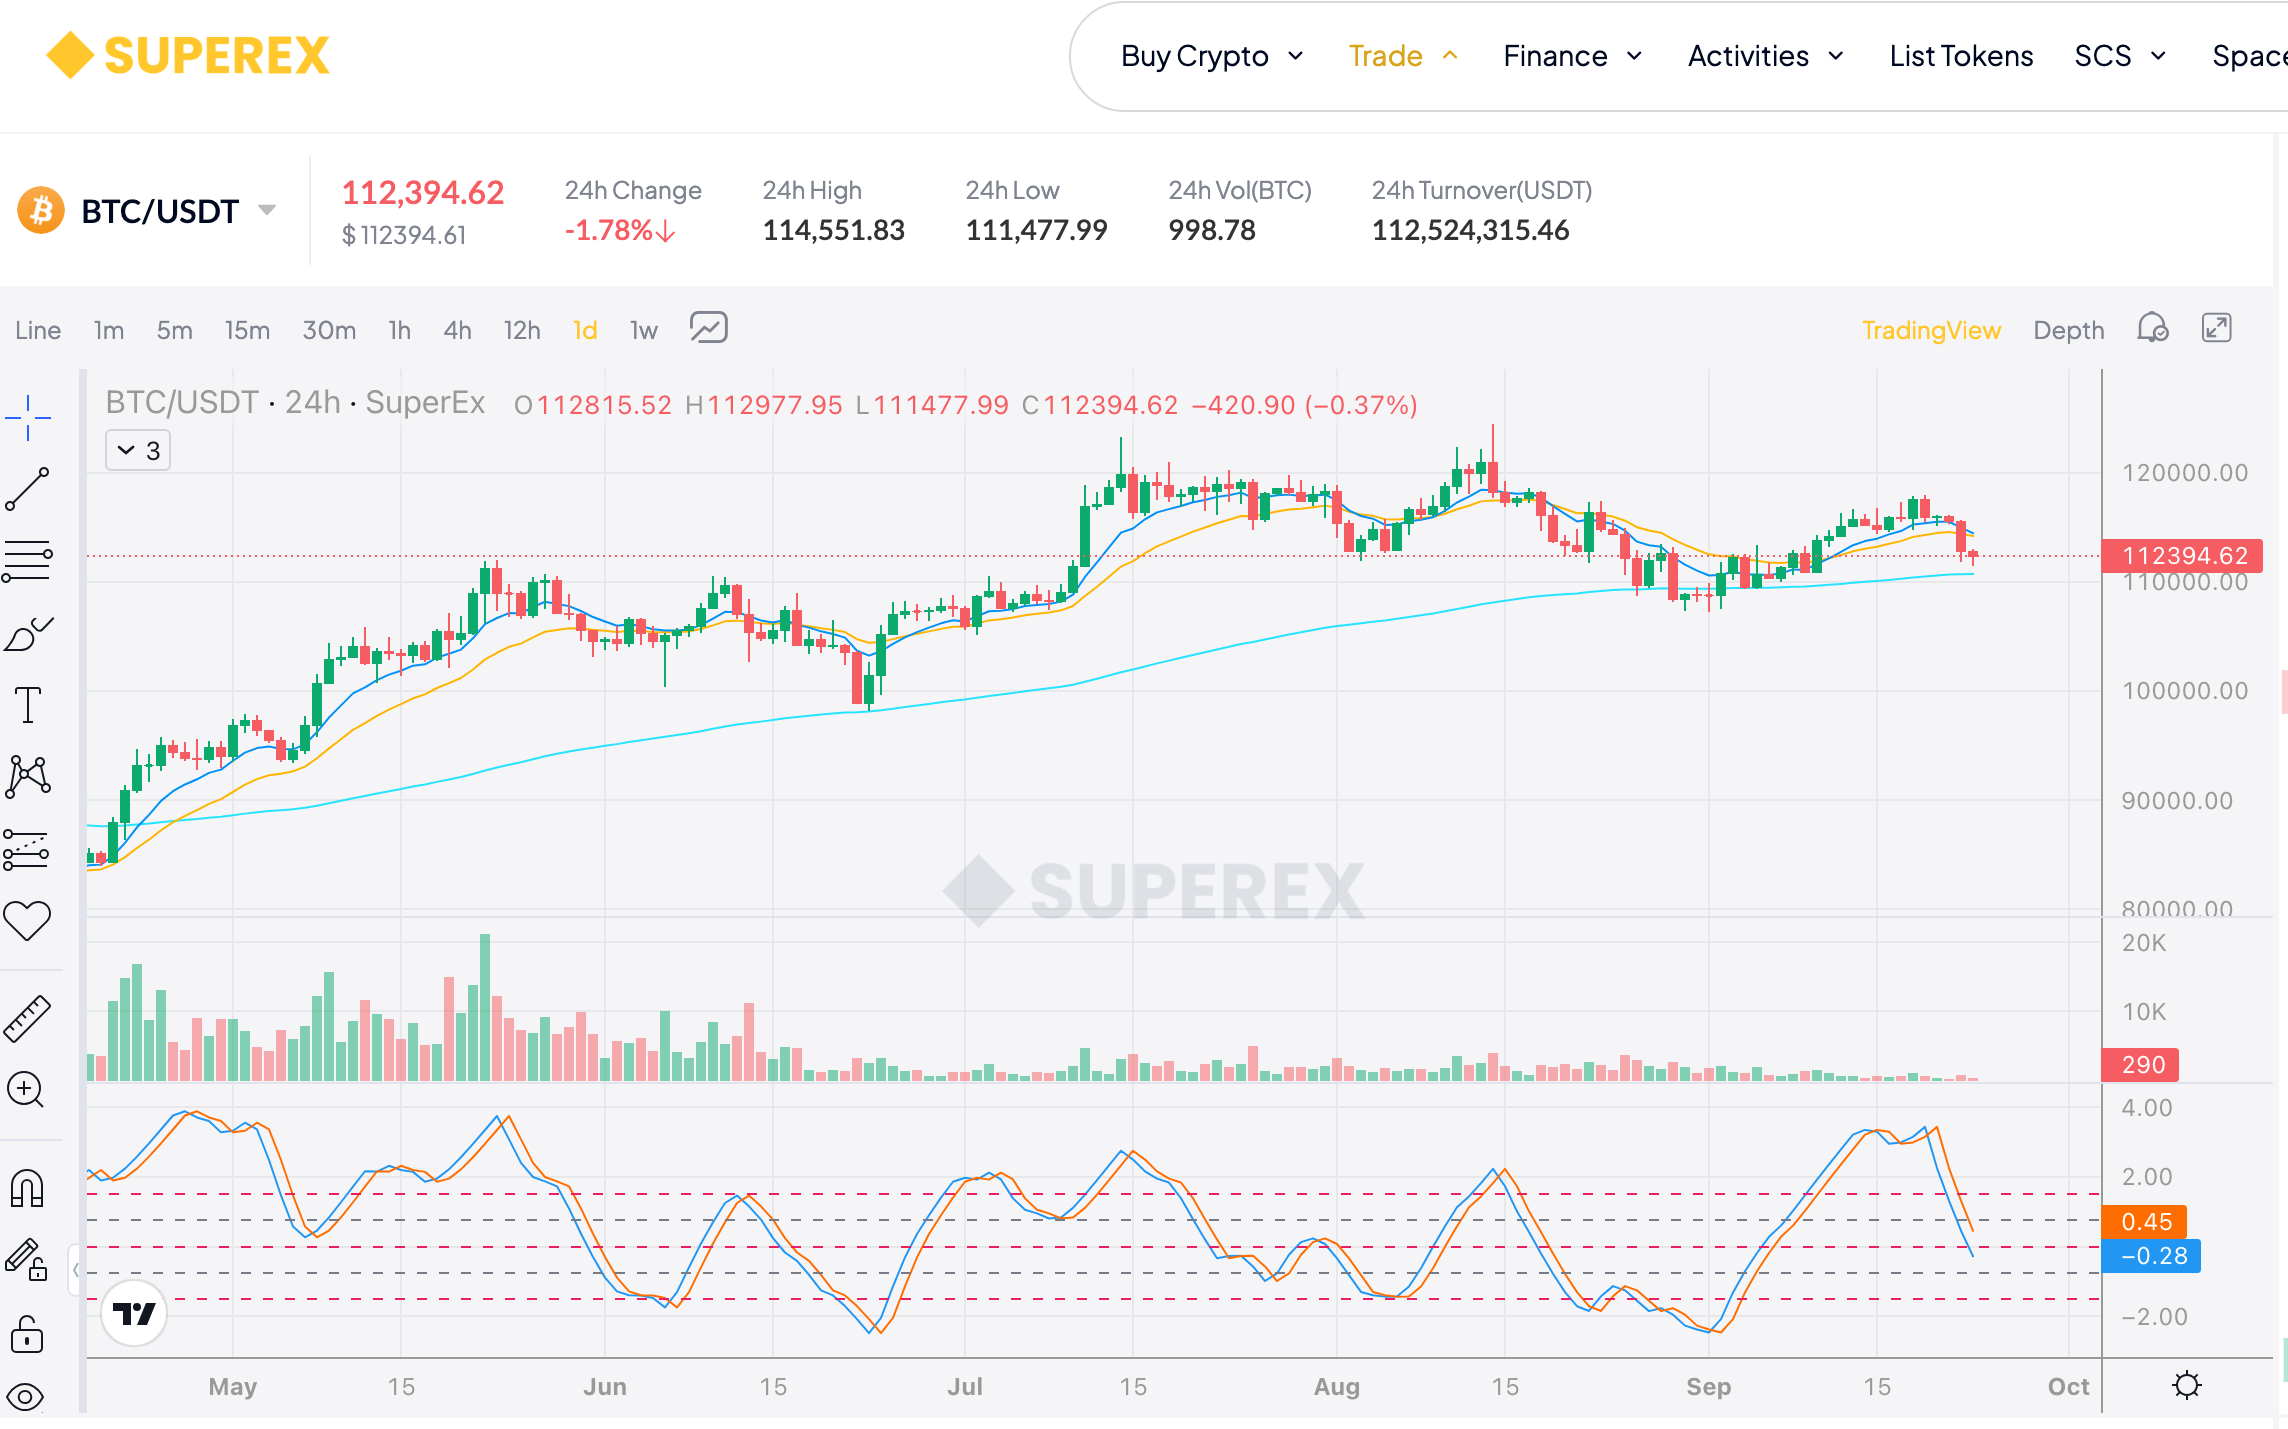
On a chart, the Fisher Transform appears as an oscillating line. While its theoretical range is unbounded, values typically reside between -2 and +2 most of the time.
How it’s calculated (three steps)
-
Normalize price
Take the highest and lowest prices over a lookback of N periods and scale today’s price into −1,+1-1, +1: x = 2 * (Price – Low(N)) / (High(N) – Low(N)) – 1, - Nonlinear amplification
Apply a log transform that accentuates extremes: Fisher = 0.5 * ln((1 + x) / (1 – x)),This pushes values near ±1 out more aggressively, highlighting turns. - Optional smoothing
To reduce noise, many implementations apply exponential-type smoothing, e.g.: Fisher_t = (Fisher_t + 0.5 * Fisher_t-1),so the curve is less jagged and false triggers are reduced.In short: standardize price → amplify extremes → (optionally) smooth to produce a curve that spotlights turning points.
You can search Fisher Transform in the SuperEx market indicator library (see screenshots).
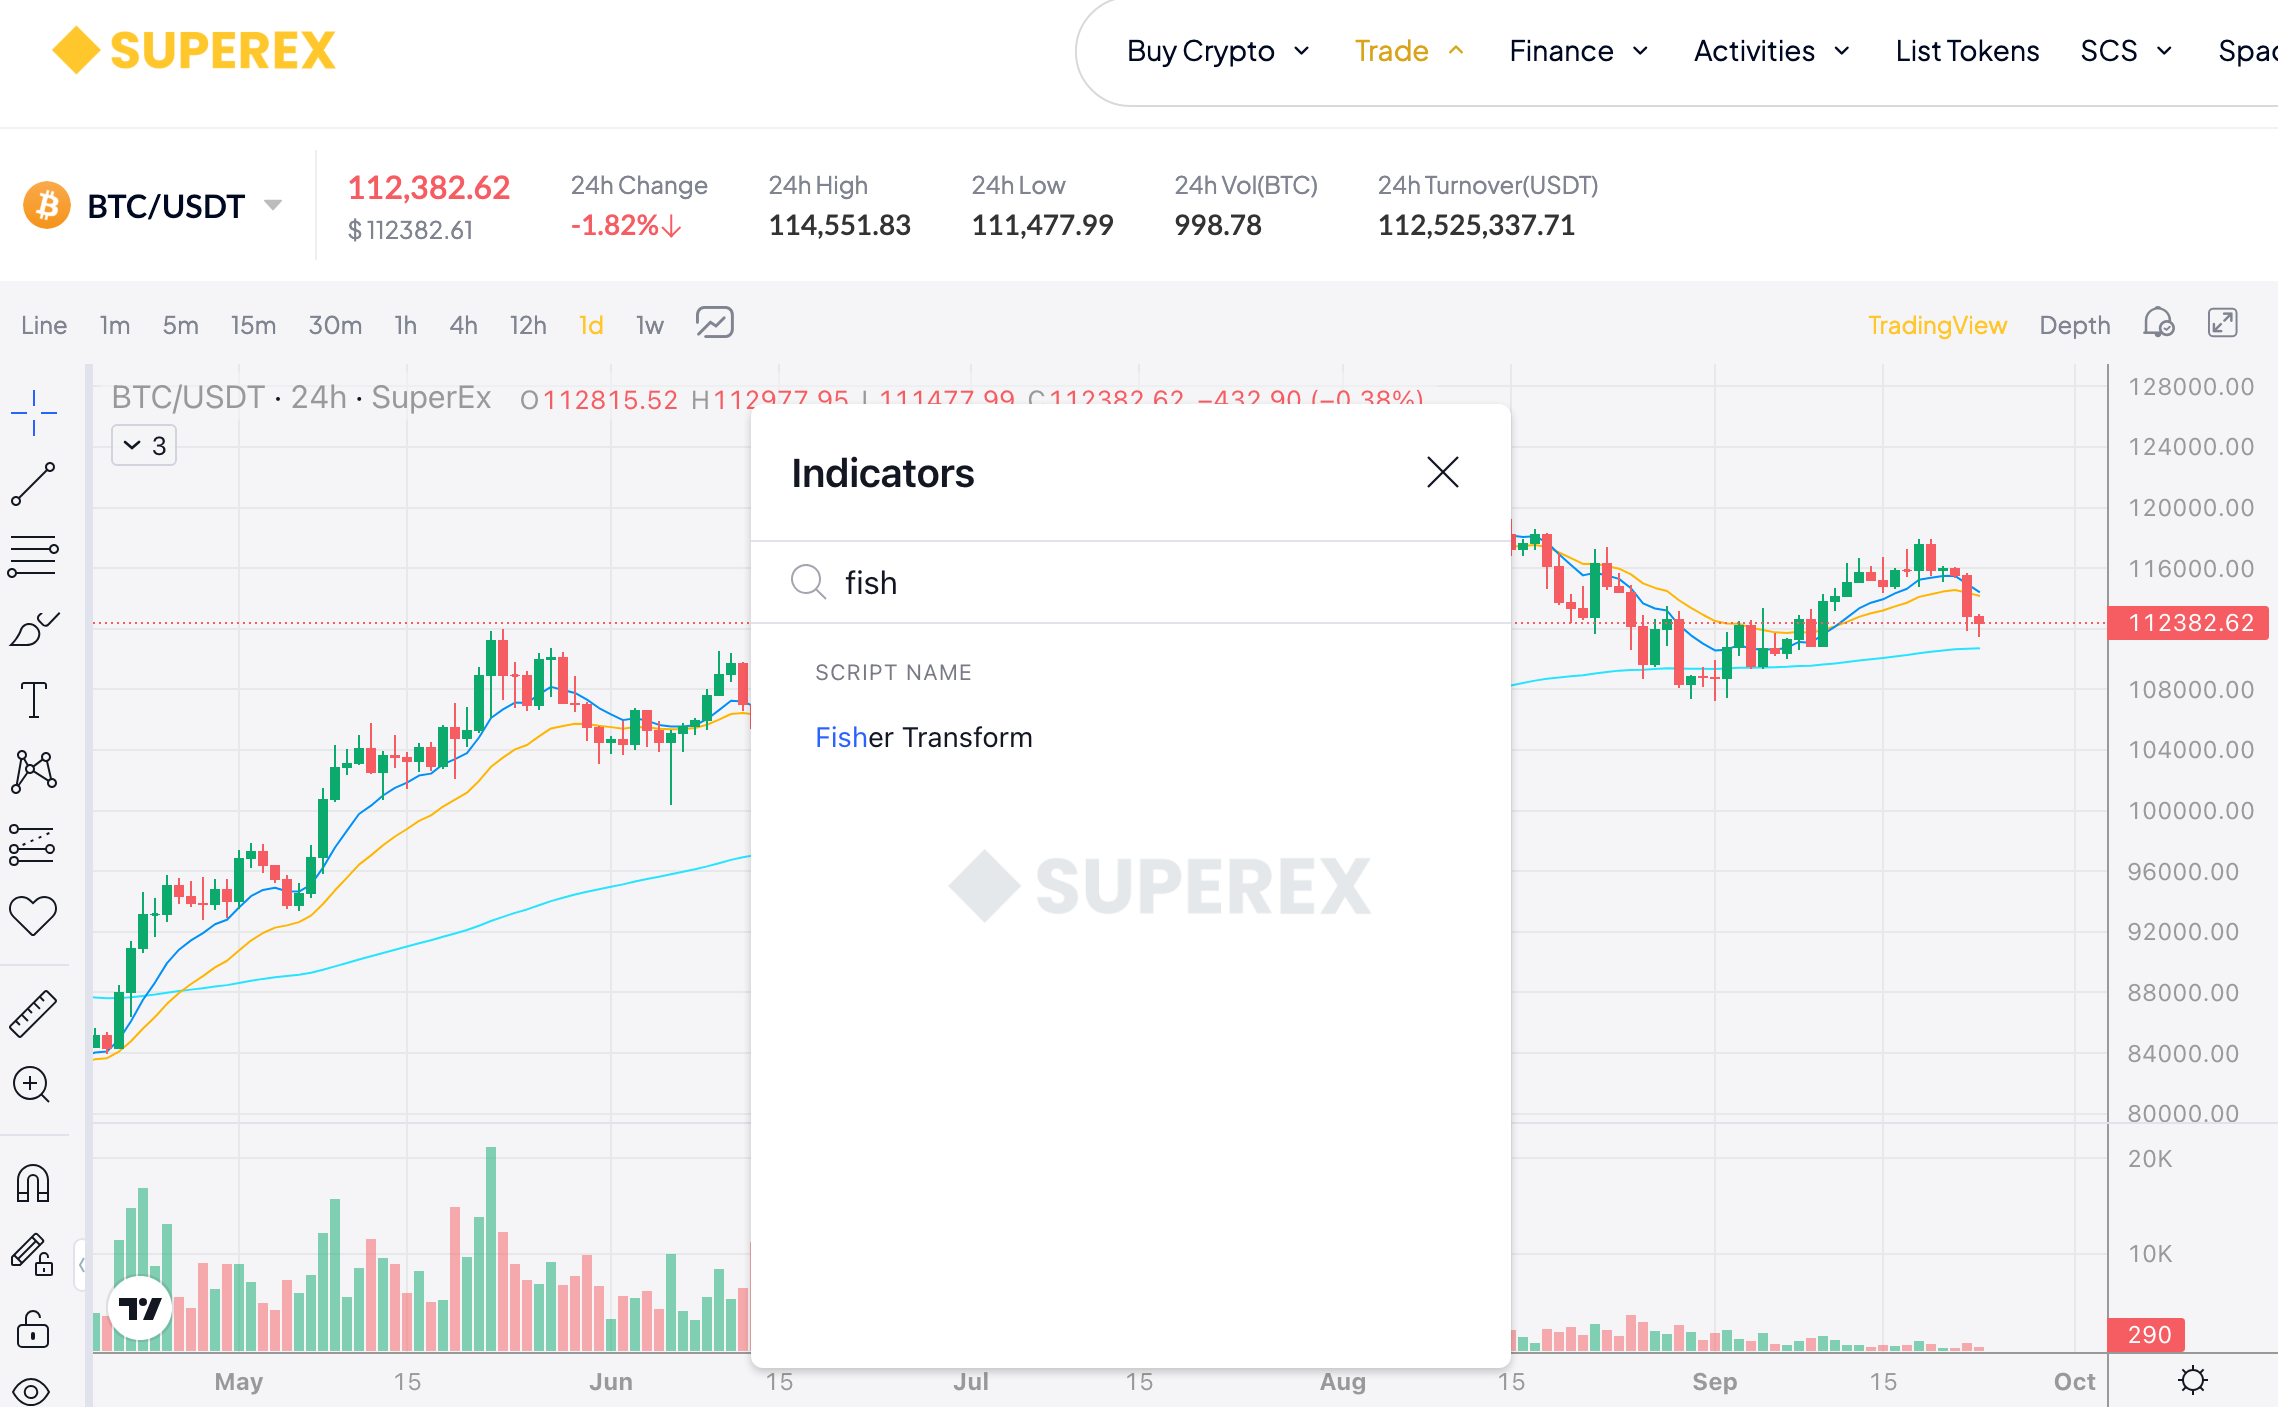
SuperEx ships sensible defaults so you can use it right away.
How to interpret the Fisher Transform
-
Zero-line trend bias
-
Fisher above 0 → bullish bias
-
Fisher below 0 → bearish bias
-
Cross signals
-
Fisher crosses up through 0 → potential buy signal
-
Fisher crosses down through 0 → potential sell signal
-
Extreme zones
-
Fisher > +2 → market may be overheated; risk of a short-term top
-
Fisher < −2 → market may be oversold; higher probability of a bounce
-
Turning-point sensitivity
-
Compared with MACD or RSI, Fisher often reacts faster to pivots, issuing earlier alerts when momentum flips.
Practical applications
-
Trend confirmation
Crypto trends can persist.
-
Fisher sustained above 0 → bull trend dominance
-
Fisher breaks and holds below 0 → bear pressure
-
Short-term reversals
Thanks to its sensitivity, it’s popular for swing entries—especially on volatile altcoins.
-
Sharp upturn from deeply negative readings → potential rebound
-
Roll-over from very high readings → potential top-warning
-
Risk management helper
Use Fisher as an exit aid:
-
In a long, if Fisher turns down, consider taking profits.
-
In a short, if Fisher turns up, consider cutting risk.
Takeaways
The Fisher Transform is an inflection-point amplifier. By mapping prices toward a normal distribution and emphasizing extremes, it makes potential reversals more visible. In practice, use it to assess trend bias, spot turns, and support stops/targets. Its trade-off is over-sensitivity, so pair it with other tools (e.g., MACD/RSI, volume, structure) to filter noise.
If MACD is a “steady trend follower,” and RSI a “market thermometer,” then Fisher is the pivot magnifier. In crypto’s high-volatility environment, it can be a very valuable addition to your toolkit.


Responses