LEARN HASH RIBBONS INDEX IN 3 MINUTES ——BLOCKCHAIN 101
If you’ve been in crypto for a while, you’ve probably realized something important:Price charts lie. On-chain data doesn’t.
When the market is down, price movements can get messy — manipulated charts, fake volumes, whale games. So how do we know when a real trend reversal is coming? What if Bitcoin has already bottomed, but we’re too scared to notice?This is where Hash Ribbons comes in — a simple but powerful on-chain metric that looks at Bitcoin’s “heartbeat” instead of its price.
- Click to register SuperEx
- Click to download the SuperEx APP
- Click to enter SuperEx CMC
- Click to enter SuperEx DAO Academy — Space
So… What Is Hash Ribbons?
Hash Ribbons is an on-chain indicator that tracks the health of Bitcoin’s mining network.
It’s made up of two lines:
- The 30-day moving average of Bitcoin’s hash rate (short-term)
- The 60-day moving average of Bitcoin’s hash rate (long-term)
These lines reflect how much computing power (hash rate) is being committed to mining Bitcoin. When miners are active, hash rate increases. When they shut down, it drops.
So why should we care?Because in crypto, miners = the biggest forced sellers.They create BTC and regularly sell to cover costs like electricity and operations. When they quit, it’s usually because the market is seriously hurting. And when they come back, it often signals the end of the pain.Hash Ribbons helps us track this miner behavior and spot potential market bottoms.
The Core Concept: Miner Capitulation
The most important idea behind Hash Ribbons is something called miner capitulation.
Here’s the logic:
When Bitcoin’s price crashes too low, it becomes unprofitable for miners to continue running their operations. Electricity bills stay the same, but the coins they mine are worth less.
So what do they do?
They shut down — either temporarily or permanently. Some even sell their BTC at a loss to stay afloat. This results in a sudden drop in network hash rate.And this is what Hash Ribbons is built to detect.
- When the 30D MA (short-term) falls below the 60D MA (long-term), it suggests miner capitulation is happening.
- When the 30D MA crosses back above the 60D MA, that’s a bullish crossover, meaning miners are returning and the worst might be over.
- A bullish crossover = miner recovery = potential market rebound
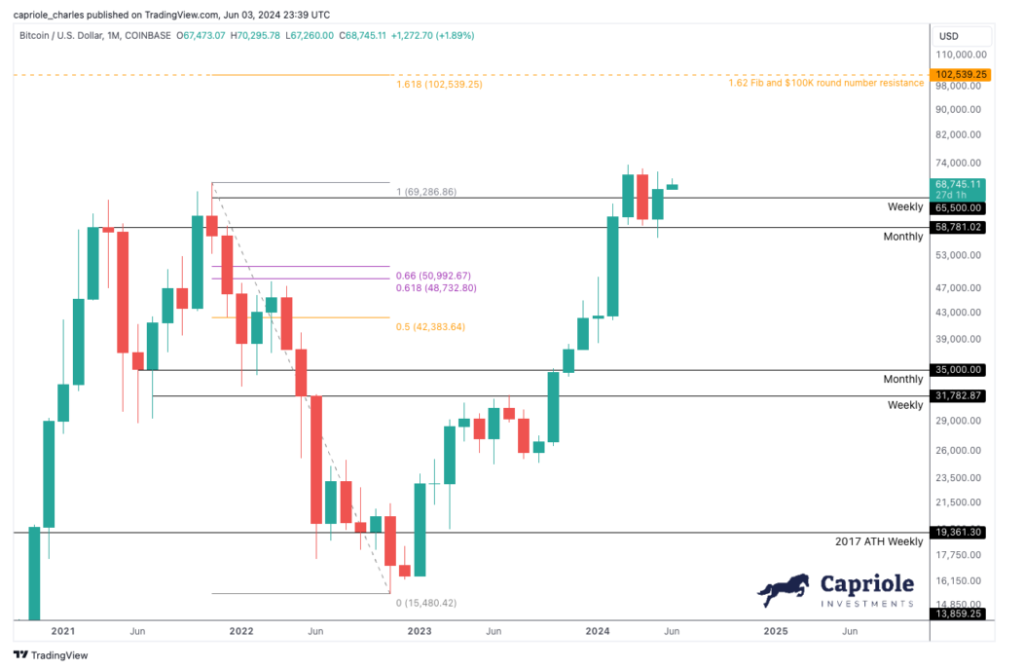
Historical Performance: Does It Actually Work?
Let’s look at some real-world examples.
- March 2020 — Covid Crash Recovery
Bitcoin crashed from $8,000 to $3,800 in March 2020. The entire crypto space was panicking.But by late April, Hash Ribbons gave a clear bullish crossover signal. Miners were back online. A few months later, Bitcoin surged to over $60,000.
- Jan 2019 — End of the 2018 Bear Market
In late 2018, Bitcoin had dropped to $3,200. Hash Ribbons signaled a bottom in early 2019.By mid-2019, BTC rallied to $14,000 — more than 4x in a few months.
- Early 2023 — Post-FTX Meltdown
After the FTX collapse in late 2022, the market was wrecked. But in January 2023, Hash Ribbons gave another bullish signal.Bitcoin rallied from ~$16,000 to $31,000 in under three months.
How to Use Hash Ribbons Like a Pro
It’s incredibly simple to read:
- Bearish Signal: 30D MA drops below 60D MA — Miner Capitulation
- Bullish Signal: 30D MA crosses above 60D MA — Miner Recovery
That’s it.But for better results, combine it with other on-chain indicators:
- Dormant Supply: Are long-term holders selling?
- LTH Supply: Are OGs accumulating or leaving?
- Exchange Inflows: Are more coins being sent to exchanges (sell pressure)?
If several of these show bullish signs together with a Hash Ribbons crossover, you may have found a
Why This Matters for Regular Investors
If you’re not a day trader, you’re probably looking for:
- Clarity in uncertain markets
- Signals that show when the worst is over
- A way to avoid panic-selling at the bottom
Hash Ribbons gives you exactly that.Because think about it — miners are the ultimate insiders. They have skin in the game. They run massive operations and monitor profitability by the minute. If they shut down, something’s wrong. If they turn back on, conditions are improving.
Following them is like tracking the smart money — not in the price chart, but in the actual network’s heartbeat.
Pro Tips for Using Hash Ribbons
If you’re planning to include this in your toolbox, keep these points in mind:
- Use it for medium to long-term trend shifts, not short-term trades.
- Review the chart monthly — not daily. This is a macro signal.
- Combine with price action, sentiment, and volume to confirm.
- You can view it on Glassnode, LookIntoBitcoin, TradingView, etc.
What’s special about Hash Ribbons isn’t that it tells you “when to buy.”It tells you when the pain might be ending.That alone makes it powerful.Most people FOMO in at the top and panic sell at the bottom. Hash Ribbons flips that script by helping you understand the behavior of the largest and most informed players in the Bitcoin economy — the miners.
Conclusion
Hash Ribbons isn’t a magic indicator. It won’t make you rich overnight, and it’s not designed for high-frequency trading.But if you’re someone who values data-driven insights and wants to understand market trends — especially when hunting for bottom signals — then Hash Ribbons is worth checking in on every month.
It reminds us that the crypto market doesn’t move randomly. It has rhythm, it has a pulse — and more often than not, that pulse can be found in the rise and fall of Bitcoin’s network hash rate.


Responses