LEARN PI CYCLE TOP INDICATOR(PI) INDEX IN 3 MINUTES – BLOCKCHAIN 101
-INDEX-IN-3-MINUTES@2x-1024x576-4.png)
In the secondary market, one of the most sought-after goals is accurately predicting the peak or bottom of market cycles. Even if predictions aren’t perfectly precise, having a general sense of certainty is highly desirable. The PI CYCLE TOP INDICATOR (PI), with its unique market signals and potential predictive capabilities, has made this dream of pinpointing market cycle tops a reality.
This article will provide a detailed analysis of the PI CYCLE TOP INDICATOR (PI), including its principles, applications, and real-world effectiveness, helping investors understand how to leverage this tool to identify market peaks.
- Click to register SuperEx
- Click to download the SuperEx APP
- Click to enter SuperEx CMC
- Click to enter SuperEx DAO Academy — Space
-INDEX-IN-3-MINUTES@2x-1024x576.png)
Origin and Definition of PI CYCLE TOP INDICATOR (PI)
The PI CYCLE TOP INDICATOR (PI) is a technical tool designed to identify the peak of a market cycle—particularly the top of Bitcoin’s bull market. First introduced by cryptocurrency analyst Philipp Hoffman in 2019, the PI was created to help traders recognize when the Bitcoin market might be nearing its cycle top, allowing them to implement sell strategies near the end of a bull market and avoid risks of a price crash.
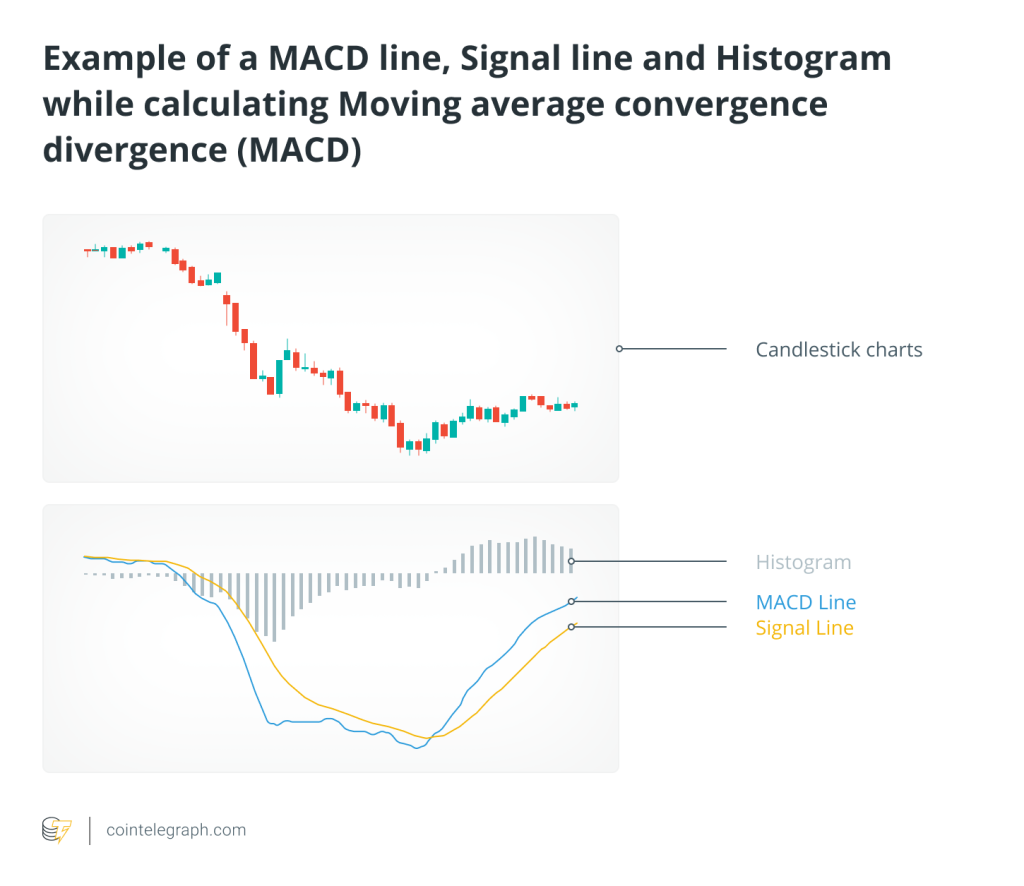
Unlike traditional technical indicators such as RSI or MACD, the PI CYCLE TOP INDICATOR (PI) does not rely on short-term price fluctuations or changes in trading volume. Instead, it focuses on the cyclical patterns in Bitcoin’s price history, using market peaks to predict future price movements. The PI indicator is calculated using Bitcoin’s 200-day moving average (MA) and a specific “cycle multiplier” to help traders spot the bull market’s peak.
How PI CYCLE TOP INDICATOR (PI) Works
The core principle of PI CYCLE TOP INDICATOR (PI) is based on the cyclical nature of Bitcoin’s historical price movements. The indicator performs the following steps for calculation and analysis:
-
200-Day Moving Average (200MA): The foundation of the PI CYCLE TOP INDICATOR (PI) is Bitcoin’s 200-day simple moving average (200MA), which represents the average price of Bitcoin over the past 200 days. This long-term trend line reflects the overall market trend, with both upward and downward movements clearly visible.
-
Cycle Multiplier and PI Value Calculation: By comparing Bitcoin’s 200MA with a fixed multiplier, PI CYCLE TOP INDICATOR (PI) calculates a potential peak signal. The multiplier used is 2.4x, so the PI value is derived by multiplying the 200MA by 2.4. When Bitcoin’s price exceeds this PI value, it typically signals that the market is nearing its peak, and the bull market is about to end. Traders should consider selling to avoid potential price crashes.
-
Historical Validation and Peak Identification: By reviewing past Bitcoin bull markets, the PI CYCLE TOP INDICATOR (PI) has successfully predicted the market’s peak multiple times. This characteristic has made PI a widely followed tool in the cryptocurrency market.

How to Use PI CYCLE TOP INDICATOR (PI) for Market Analysis
In actual trading, the PI CYCLE TOP INDICATOR (PI) is not a standalone tool but should be used in conjunction with other technical indicators to confirm the market peak signals. Here are some common applications:
-
Identifying Bull Market Tops: The most straightforward application of the PI CYCLE TOP INDICATOR (PI) is to help traders identify the peak of a Bitcoin bull market. Whenever Bitcoin’s price breaks through the PI value (200MA * 2.4), it indicates that Bitcoin is entering the top of a cycle. At this point, traders may consider reducing their positions, taking profits, or using stop-loss strategies to protect themselves from a sudden market reversal.
-
Combining with Other Technical Indicators: Although PI CYCLE TOP INDICATOR (PI) is highly effective in identifying bull market tops, it is not foolproof. To increase the accuracy of analysis, many traders combine PI with other common indicators like RSI, Bollinger Bands, and MACD. These indicators help traders confirm the signals provided by PI, enhancing the reliability of trading decisions.
-
Risk Control for Long-Term Investors: For long-term investors, PI CYCLE TOP INDICATOR (PI) can serve as an essential risk management tool. Even if short-term selling is not the plan, the PI indicator can help them monitor market volatility and decide when to adjust their portfolio to avoid significant losses due to a market collapse.
-
Predicting Periodic Market Corrections: The PI CYCLE TOP INDICATOR (PI) can also be used not only for identifying market tops but also for predicting potential market corrections after a bull market. By combining PI with other analytical tools, traders can anticipate the depth of potential market pullbacks and take preemptive action to protect their capital.
Successful Case Studies of PI CYCLE TOP INDICATOR (PI)
The PI CYCLE TOP INDICATOR (PI) has successfully predicted multiple Bitcoin market peaks in history. Here are some notable examples:
-
2013 Bitcoin Bull Market Top: In 2013, Bitcoin experienced a rapid rise in price, breaking through the PI CYCLE TOP INDICATOR (PI) threshold. Shortly afterward, Bitcoin’s price experienced a massive pullback, dropping over 50% from its peak. This correction aligned closely with the PI indicator’s peak signal, helping traders avoid the risk.
-
2017 Bitcoin Bull Market Top: In 2017, Bitcoin underwent an unprecedented bull market, with prices approaching the $20,000 mark. The PI CYCLE TOP INDICATOR (PI) predicted that Bitcoin’s price was nearing its peak, and shortly after, the market experienced a steep correction, with prices plummeting to around $6,000. This market correction again validated the effectiveness of PI in identifying market tops.
Limitations and Risks of PI CYCLE TOP INDICATOR (PI)
While the PI CYCLE TOP INDICATOR (PI) has shown solid performance in predicting market cycles, it is not infallible. The high volatility of the cryptocurrency market and external factors such as macroeconomic policies or market sentiment changes can lead to false signals from the PI indicator. Therefore, traders should always combine the PI with other technical analysis tools for confirmation to increase the accuracy of predictions.
Moreover, the PI CYCLE TOP INDICATOR (PI) is better suited for short-term market peak predictions. Long-term investors should still consider fundamental analysis and macroeconomic factors when developing investment strategies.
Conclusion: The Future Development and Application of PI CYCLE TOP INDICATOR (PI)
As a technical tool based on the cyclical nature of Bitcoin’s price movements, the PI CYCLE TOP INDICATOR (PI) has been widely adopted in the cryptocurrency market. While it is not perfect, it undeniably provides valuable market signals for identifying bull market tops and helping traders avoid risk. As the crypto market continues to evolve, the PI indicator may undergo further optimization and improvements, offering traders even more precise market analysis.
In conclusion, the PI CYCLE TOP INDICATOR (PI) is a powerful tool for capturing key turning points in the volatile cryptocurrency market. However, like all technical indicators, it should be used in conjunction with other methods to create a more comprehensive and effective trading strategy.


Responses