LEARN PIVOT POINTS STANDARD INDEX IN 3 MINUTES – BLOCKCHAIN 101

Pivot Points Standard Index is a widely-used technical indicator in financial markets, helping traders identify key support and resistance levels. Whether you’re trading cryptocurrencies, forex, stocks, or commodities, mastering pivot points can significantly enhance your trading strategies.
In this guide, we’ll explore what pivot points are, how they’re calculated, and how you can use them to improve your decision-making in just three minutes.
- Click to register SuperEx
- Click to download the SuperEx APP
- Click to enter SuperEx CMC
- Click to enter SuperEx DAO Academy — Space

What Are Pivot Points?
Pivot Points are technical analysis indicators that identify price levels of potential support and resistance. They are calculated using the previous day’s high, low, and closing price. Traders use pivot points to determine market sentiment, potential reversal zones, and key levels for entering or exiting trades.
Unlike lagging indicators such as moving averages, pivot points are forward-looking, providing traders with a clear roadmap of price levels for the current trading session.
How Are Pivot Points Calculated?
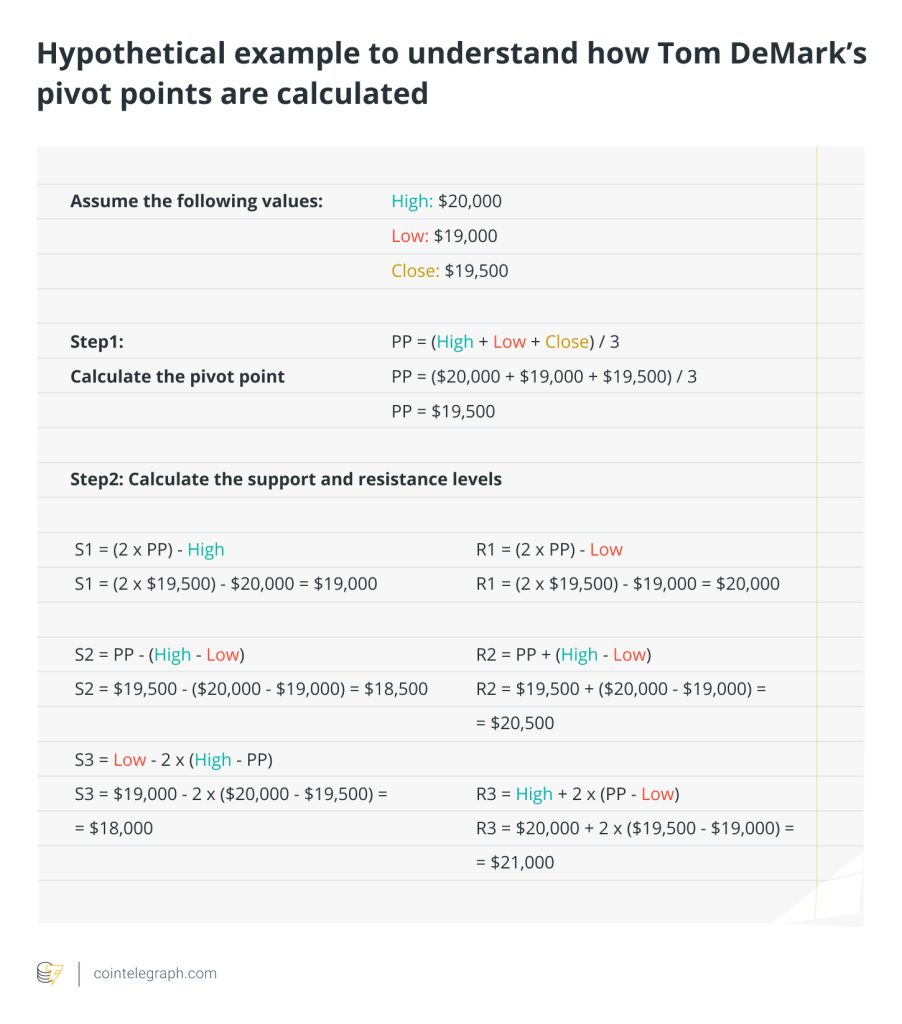
The Formula for Pivot Points:
Pivot Point (PP):
- PP=(High+Low+Close)/3
Support Levels (S):
- S1: S1=(2×PP)−High
- S2: S2=PP−(High−Low)
Resistance Levels (R):
- R1: R1=(2×PP)−Low
- R2: R2=PP+(High−Low)
These calculations generate a set of levels (PP, R1, R2, S1, S2) that traders can use to predict potential market movements.
Automated Calculation Tools:
Don’t worry if math isn’t your strong suit! SuperEx provide Pivot Points as a built-in indicator, saving you time while ensuring accuracy.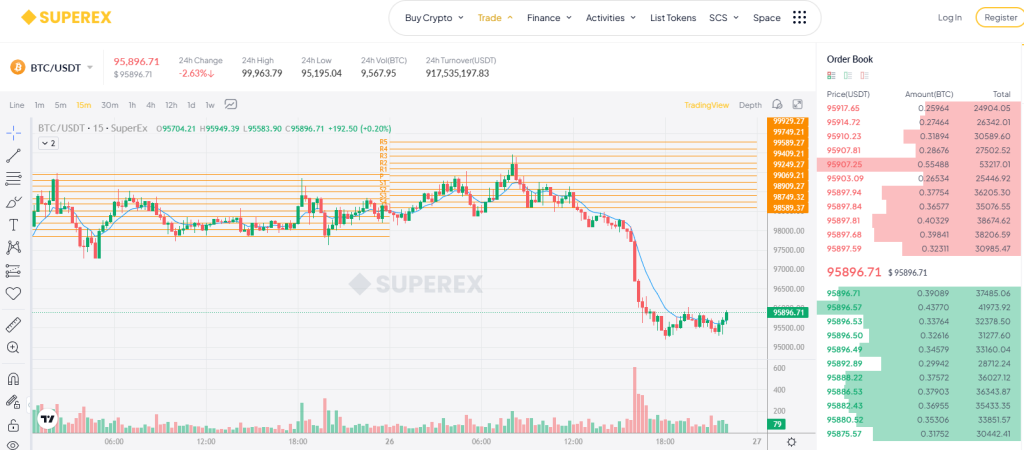
How to Use Pivot Points in Trading
1. Determining Market Sentiment
The position of the current price relative to the pivot point helps gauge market sentiment:
- Above the Pivot Point: Bullish sentiment.
- Below the Pivot Point: Bearish sentiment.
2. Identifying Support and Resistance Levels
- Resistance Levels (R1, R2): These are levels where the price may face selling pressure.
- Support Levels (S1, S2): These are levels where the price may encounter buying interest.
3. Entry and Exit Points
Pivot Points act as guideposts for entering and exiting trades:
- Buy Near Support: When the price approaches support levels (S1, S2) and shows signs of reversal.
- Sell Near Resistance: When the price nears resistance levels (R1, R2) and exhibits reversal patterns.
4. Set Stop-Loss and Take-Profit Levels
Pivot Points help you strategically set stop-loss orders below support levels or above resistance levels to limit potential losses while maximizing gains.
Example: Pivot Points in Action
Imagine Bitcoin (BTC) closed yesterday at $25,000(In the case, the price of BTC is only for the convenience of calculation), with a high of $26,000 and a low of $24,000.
- Pivot Point (PP): (26,000+24,000+25,000)3=25,000
- Resistance Levels:
- R1=(2×25,000)−24,000=26,000
- R2=25,000+(26,000−24,000)=27,000
- Support Levels:
- S1=(2×25,000)−26,000=24,000
- S2=25,000−(26,000−24,000)=23,000
Using these levels, you notice BTC is trading at $25,800, just below R1 ($26,000). A cautious trader might wait for a rejection at R1 before shorting or anticipate a breakout above R1 for a long trade.
Pivot Points and Other Indicators
1. Pivot Points + RSI
Combine pivot points with the Relative Strength Index (RSI) to filter false signals. For example:
- If the price approaches R1 but RSI is overbought, a reversal is more likely.
- If the price nears S1 with RSI in oversold territory, a bounce back is probable.
2. Pivot Points + Moving Averages
Use moving averages (e.g., 20-day SMA) to confirm trends:
- When the price is above both the pivot point and moving average, it strengthens a bullish bias.
- Conversely, if the price is below, bearish sentiment dominates.
Common Mistakes and How to Avoid Them
- Ignoring Market Context
Pivot points work best in trending or ranging markets but may be less effective during periods of extreme volatility or fundamental news events. - Relying Solely on Pivot Points
While they’re a powerful tool, always pair them with other indicators or patterns for higher accuracy. - Overtrading Every Signal
Not every touch of a pivot level is actionable. Focus on high-probability setups supported by volume and momentum indicators.
Conclusion
Mastering the Pivot Points Standard Index can be a game-changer for your trading strategy. By providing clear levels of support and resistance, pivot points allow traders to anticipate market movements, manage risks, and seize profitable opportunities.
Whether you’re a novice or a seasoned trader, incorporating pivot points into your toolkit is a step towards more informed and confident trading decisions.
Take the first step now—open your trading platform, add the Pivot Points indicator, and start exploring how it transforms your trading journey.



-INDEX-IN-3-MINUTES@2x-1024x576-4.png)
Responses