LEARN PRICE VOLUME TREN INDEX IN 3 MINUTES – BLOCKCHAIN 101

The Price Volume Trend (PVT) Index is a valuable tool in the arsenal of traders and investors who seek to gauge market trends and momentum. As an enhanced hybrid of volume and price movement, the PVT combines elements of traditional volume indicators with price action to provide a clearer picture of market sentiment. In this article, we’ll explore the basics, applications, and limitations of PVT to help you master this versatile indicator in under three minutes.
- Click to register SuperEx
- Click to download the SuperEx APP
- Click to enter SuperEx CMC
- Click to enter SuperEx DAO Academy — Space

What is the Price Volume Trend (PVT) Index?
The Price Volume Trend Index is a technical analysis indicator that measures the strength of a trend based on price changes and trading volume. Unlike similar tools like the On-Balance Volume (OBV), which adds or subtracts full volume depending on price direction, PVTts the volume proportionally to the percentage price change.
Formula for PVT
PVT=Previous PVT+{(Close Price Today−Close Price Yesterday)/Close Price Yesterday}*Volume
Key Components of PVT
- Price Movement: PVT captures how significant price movements contribute to trend development. Strong price swings amplify the PVT, while minor fluctuations result in minimal adjustments.
- Trading Volume: The volume is the power behind the trend. Higher volume during price changes reflects greater conviction among traders, making the trend more reliable.
How to Interpret the Price Volume Trend Index
1. Identifying Trends
- Uptrend in PVT: Indicates strong buying momentum. When PVT rises alongside price, it confirms the uptrend’s validity.
- Downtrend in PVT: Suggests strong selling pressure. A falling PVT in sync with a price decline indicates a robust bearish trend.
2. Divergences
- Bullish Divergence: Price decreases while PVT trends upward. This can signal that buyers are stepping in despite falling prices, often a precursor to a reversal.
- Bearish Divergence: Price increases while PVT trends downward. This suggests weakening buying pressure, potentially foreshadowing a price correction.
3. Confirming Breakouts
PVT is particularly effective in validating breakouts. A price breakout accompanied by a sharp increase in PVT suggests strong participation, making the breakout more likely to sustain.
How to Use PVT in Trading Strategies
1. Trend Confirmation
Pair PVT with trend-following indicators like moving averages or trendlines. When both price and PVT break above a resistance level, it signals a strong buy opportunity.
2. Divergence-Based Trading
- Identify divergence patterns between price and PVT.
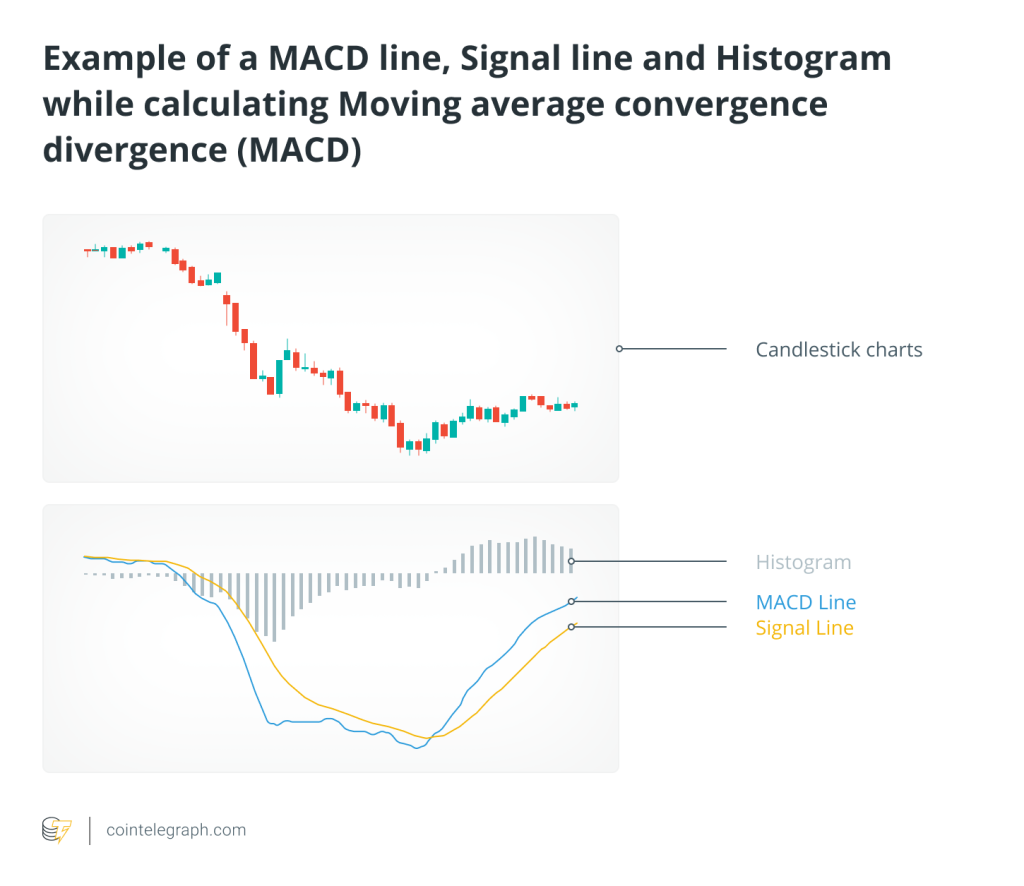
- Use additional indicators like Relative Strength Index (RSI) or MACD to confirm the signal.
3. Volume-Weighted Entry/Exit Points
- Use PVT to time entries during strong volume-driven uptrends.
- Exit positions when PVT starts diverging from price in your trade direction, signaling a potential reversal.
Strengths of PVT
- Combines Price and Volume: PVT bridges the gap between these two critical metrics, offering a more balanced view than indicators focusing on only one aspect.
- Effective for Confirmation: PVT is a reliable secondary indicator to validate primary signals from other tools.
- Divergence Insights: Helps identify subtle shifts in market sentiment that might go unnoticed with traditional indicators.
Limitations of PVT
- Delayed Signals: As with most trend-following indicators, PVT is prone to lag, especially in highly volatile markets.
- Not Standalone: It’s most effective when used in conjunction with other indicators or technical patterns.
- Volume Data Dependency: The accuracy of PVT relies on reliable volume data, which can be inconsistent across exchanges, especially in crypto markets.
Case Study: Applying PVT to Cryptocurrency Markets
Bitcoin (BTC) Breakout Example
In December 2020, Bitcoin’s price broke the $20,000 resistance level. During this period:
- The PVT showed a significant uptick, reflecting strong volume-driven momentum.
- The PVT’s rise mirrored the price breakout, confirming the move as sustainable.
Key Takeaways
- PVT helped confirm the validity of the breakout.
- Traders who used PVT as a secondary confirmation tool could have capitalized on the rally while mitigating risks of false breakouts.
Tips for Using PVT Effectively
- Combine with Volume Indicators: Use PVT alongside tools like Volume Weighted Average Price (VWAP) for a comprehensive view of volume dynamics.
- Monitor Divergences Closely: Divergences are often leading indicators of reversals; pay attention to them for early trade opportunities.
- Backtest Strategies: Always test PVT-based strategies on historical data before deploying them in live trading to ensure effectiveness.
Conclusion
The Price Volume Trend (PVT) Index is a powerful yet straightforward tool for analyzing market trends and momentum. By integrating price action with volume, it offers insights into the conviction behind market movements. While it’s not a one-size-fits-all solution, combining PVT with other technical indicators and sound risk management strategies can significantly enhance your trading edge.
Whether you’re trading stocks, forex, or cryptocurrencies, mastering the PVT can help you identify trends, validate breakouts, and spot potential reversals with greater confidence.


Responses