LEARN RATIO INDEX IN 3 MINUTES – BLOCKCHAIN 101
In the crypto market, price volatility is a daily phenomenon traders must navigate. Effective technical analysis tools help traders identify market trends, reduce impulsive decisions, and improve success rates. Among many indicators, one often overlooked yet highly practical tool is the RATIO Index. In just 3 minutes, this article will help you understand the core concepts, calculations, and real-world applications of the RATIO Index.
What is the RATIO Index?
The RATIO Index is essentially a relative strength indicator that measures the performance between two assets or markets. It helps traders identify which asset or market is currently outperforming the other.
Simply put, the RATIO Index calculates the price ratio of Asset A to Asset B to reveal their relative strength. For example, when the A/B RATIO rises, Asset A is outperforming Asset B; when it declines, Asset B is stronger.
Example:
- Suppose you are comparing Bitcoin (BTC) and Ethereum (ETH). If BTC’s price increases more significantly than ETH’s, the BTC/ETH RATIO will rise.
- If the RATIO continues to rise, it indicates that BTC is attracting more capital and maintaining its dominant position. Conversely, a declining RATIO suggests ETH is gaining relative strength.
The RATIO Index is not limited to single-asset analysis; it’s also ideal for cross-market and cross-asset analysis, helping traders pinpoint the most valuable opportunities.
How to Calculate the RATIO Index?
The formula for the RATIO Index is straightforward:
RATIO= Price of Asset A / Price of Asset B
- Asset A: The asset or index you want to analyze.
- Asset B: The benchmark asset or index for comparison.
Example:
If BTC is currently priced at $100,000, and ETH is $4,000, the BTC/ETH RATIO would be:
RATIO=100000/4000=25
The next day, if BTC rises to $102,000 and ETH increases to $4,400, the new RATIO would be:
RATIO=102000/4400≈23.18
Here, although both assets have risen, the BTC/ETH RATIO has declined, indicating ETH’s relative strength is greater.
Market Applications of the RATIO Index
1)Strength Comparison: Choosing the Best Asset to Trade
The RATIO Index is widely used to compare the relative strength of two assets, helping investors select the most promising option.
Example:
- During a bear market, traders can use the RATIO Index to identify assets with stronger downside resilience.
- In a bull market, it helps pinpoint assets with the most momentum for maximum gains.
Case Study:
Suppose you analyze BTC and ETH at the start of 2024:
- On January 1, the BTC/ETH RATIO is 30.
- By February 1, the RATIO drops to 28.
Although BTC’s price increased, the drop in the RATIO reveals that ETH outperformed BTC. Traders can prioritize ETH to capitalize on its relative strength.
2) Market Rotation: Capturing Sector Opportunities
The RATIO Index is also effective for analyzing market rotation, especially when capital flows between different assets.
Practical Strategy:
- When the RATIO is consolidating at a high or starts declining, it signals that capital may be shifting from Asset A to Asset B.
- When the RATIO rebounds from a low, Asset A may regain market favor, presenting a buying opportunity.
Real-World Scenarios:
(1)Bitcoin vs. Altcoins:
- In the early stages of a bull market, capital typically flows into Bitcoin, causing the BTC/Altcoin RATIO to rise.
- When the RATIO starts to decline, altcoins often enter a breakout phase.
(2)Mainstream Coins vs. MEME Coins:
By monitoring the RATIO between mainstream coins (like ETH) and MEME coins (like PEPE), traders can detect shifts in market risk appetite and adjust their strategies accordingly.
3)Trend Confirmation: Supporting Trend Analysis
The RATIO Index can serve as a trend confirmation tool, especially when used alongside other technical indicators to improve accuracy.
Common Combinations:
- Moving Average (MA): Combine the RATIO with a moving average to identify breakouts or trend reversals.
- Relative Strength Index (RSI): When the RATIO’s RSI is overbought, a correction may follow; when oversold, watch for a potential rebound.
Practical Example:
- If the BTC/ETH RATIO stays above its 50-day moving average and RSI remains above 50, BTC’s relative strength is likely to persist.
- If the RATIO breaks below the moving average and RSI enters oversold territory, ETH may present a buying opportunity.
The RATIO Index provides a simple yet powerful way to analyze the relative performance of two assets. In the fast-paced crypto market, where capital moves quickly and asset performance varies greatly, the RATIO Index helps traders:
- Choose strong-performing assets to maximize profits.
- Capture market rotations and capitalize on shifts in capital flow.
- Confirm trends and optimize trading strategies.
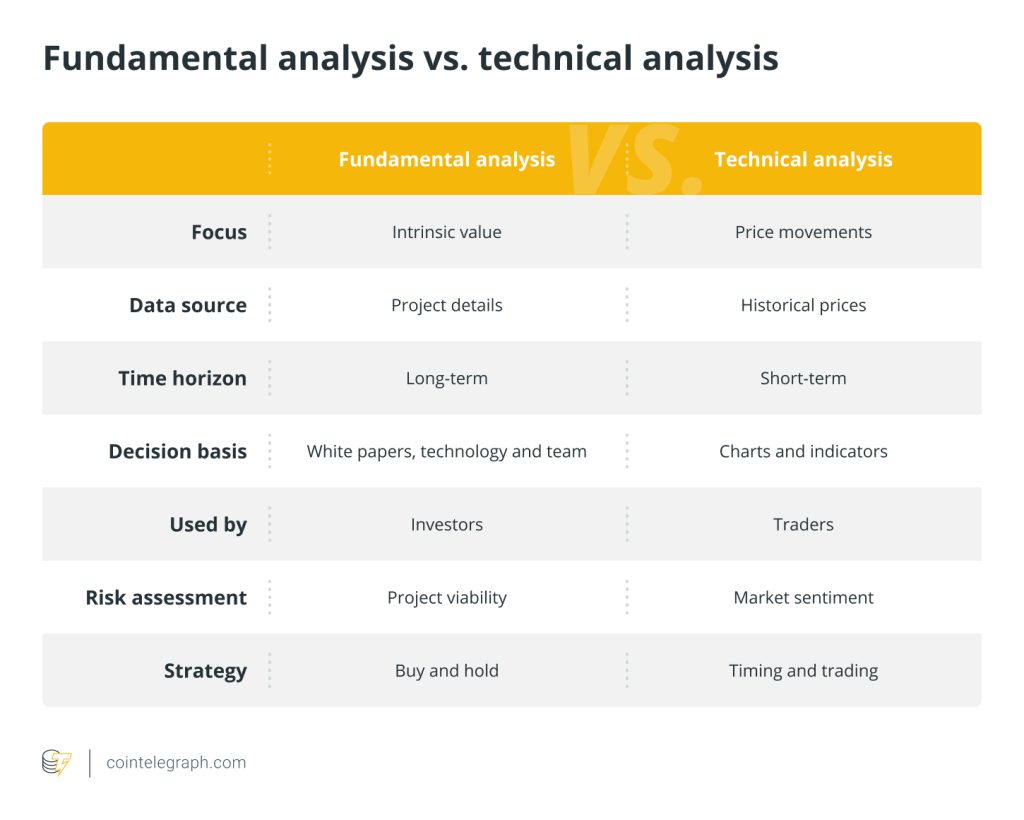
However, like all indicators, the RATIO Index is most effective when combined with other tools and fundamental analysis.


Responses