LEARN Moving Average Double (MAD) INDEX IN 3 MINUTES——BLOCKCHAIN 101

Technical indicators play a critical role in trading strategies, offering insights into market trends and helping traders make informed decisions. Among the myriad indicators, the Moving Average Double (MAD) stands out as a versatile tool for identifying trends and potential entry/exit points.
In this article, we’ll delve into the fundamentals of the MAD indicator, how to use it effectively, and its advantages and limitations.
- Click to register SuperEx
- Click to download the SuperEx APP
- Click to enter SuperEx CMC
- Click to enter SuperEx DAO Academy — Space

1. What is the Moving Average Double (MAD) Indicator?
The Moving Average Double indicator uses two moving averages (MAs) with different periods to track price trends and potential reversals. Typically, one is a shorter-term MA (e.g., 10 or 20 periods) to capture immediate price movements, and the other is a longer-term MA (e.g., 50 or 100 periods) to reflect the overall trend.
How it Works
- The shorter-term MA responds quickly to price changes, showing short-term momentum.
- The longer-term MA lags behind and represents the general direction of the market.
- When these two MAs cross over, they generate buy or sell signals.
Key Signals
- Golden Cross: The shorter MA crosses above the longer MA, indicating a potential upward trend or bullish signal.
- Death Cross: The shorter MA crosses below the longer MA, signaling a potential downward trend or bearish signal.
2. Setting Up the MAD Indicator
Choosing Moving Average Types
MAD can use different types of moving averages depending on your trading style:
- Simple Moving Average (SMA): Calculates the average price over a set number of periods. Best for long-term traders.
- Exponential Moving Average (EMA): Gives more weight to recent prices, making it ideal for short-term traders.
Selecting Time Periods
The time periods for the two moving averages should align with your trading strategy:
- Day Traders: Commonly use 9-period and 21-period EMAs for quick signals.
- Swing Traders: Often prefer 20-period and 50-period SMAs for medium-term trends.
- Long-Term Investors: Opt for 50-period and 200-period SMAs to capture major market movements.
Adding MAD to Your Chart
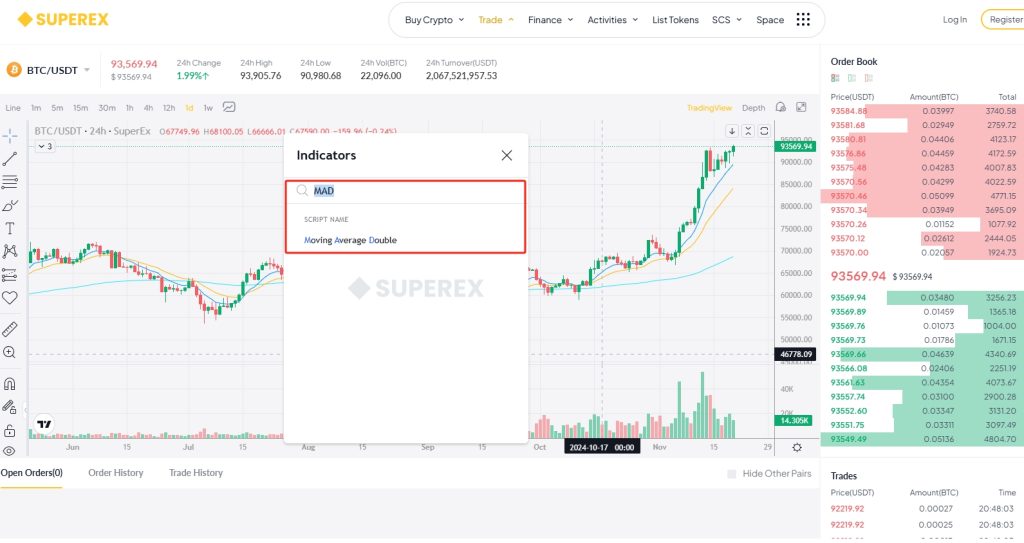
Most trading platforms, such as SuperEx, allow you to overlay two MAs on the price chart. Select your preferred MA type and time period, and ensure the lines are distinguishable by color or thickness.

3. Interpreting the MAD Indicator
Trend Identification
- Bullish Trend: When the shorter MA consistently stays above the longer MA, the market is trending upwards.
- Bearish Trend: When the shorter MA stays below the longer MA, the market is trending downwards.
Buy and Sell Signals
- Buy Signal:
- Occurs when the shorter MA crosses above the longer MA.
- Confirm the signal with volume or other indicators like the Relative Strength Index (RSI).
- Sell Signal:
- Happens when the shorter MA crosses below the longer MA.
- Use confirmation tools such as candlestick patterns or support/resistance levels to validate.
Filter Out Noise
False signals can occur during sideways markets. To mitigate this:
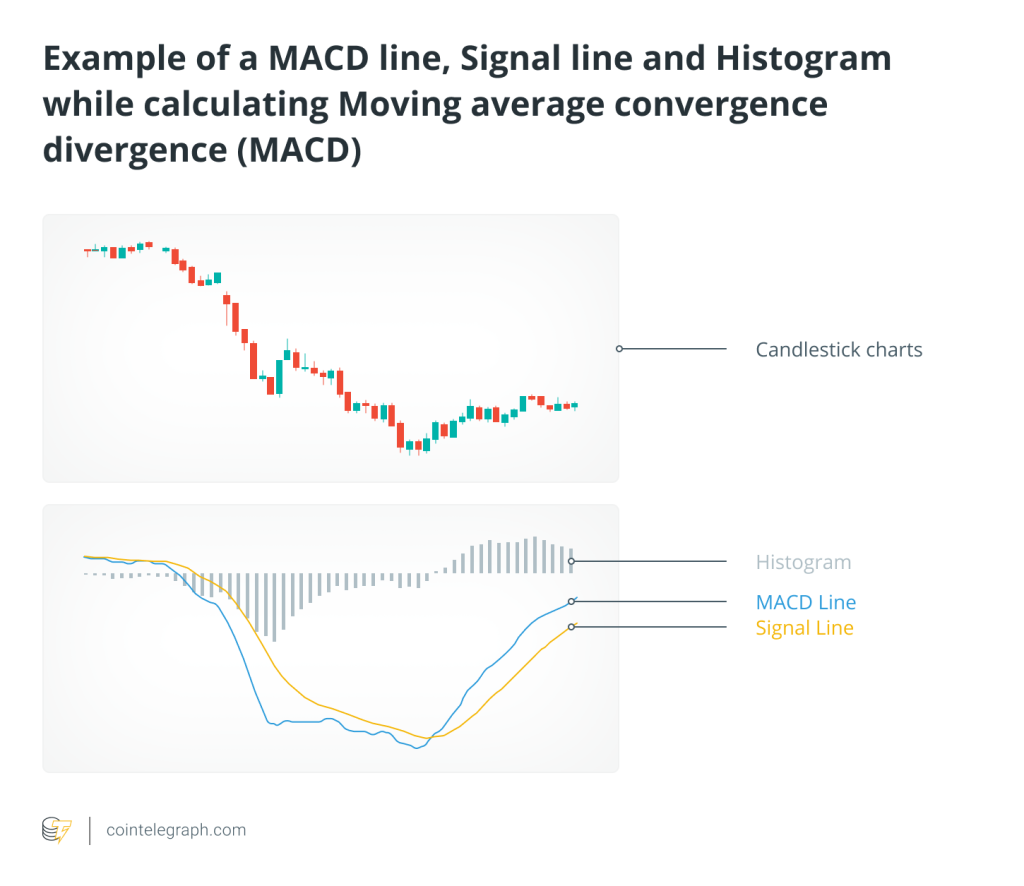
- Use additional indicators like MACD or Bollinger Bands for confirmation.
- Avoid trading MAD signals during low volatility periods.
4. Advantages of the MAD Indicator
1. Simple and Intuitive
The MAD indicator’s visual crossover system makes it easy for traders of all levels to use.
2. Versatility
MAD works across multiple markets, including stocks, forex, and cryptocurrencies.
3. Dynamic Adjustments
Traders can adjust the MA periods to suit their trading style, making the indicator highly adaptable.
4. Trend Confirmation
By using two MAs, MAD helps confirm trends, reducing the likelihood of false signals compared to a single MA.
5. Limitations of the MAD Indicator
1. Lagging Nature
Both moving averages are based on historical prices, meaning signals can lag behind current market conditions.
2. Ineffectiveness in Sideways Markets
MAD struggles in range-bound markets, generating false signals during periods of low volatility.
3. Requires Additional Confirmation
While effective, relying solely on MAD can lead to errors. Combine it with other indicators for more robust trading decisions.
6. Trading Strategies Using MAD
1. Trend-Following Strategy
This strategy involves trading in the direction of the crossover:
- Enter long positions during a golden cross and hold as long as the trend persists.
- Exit when a death cross occurs or when the shorter MA begins to flatten.
2. Reversal Trading Strategy
MAD can also help identify potential reversals:
- Enter short positions during a death cross, especially when accompanied by a bearish candlestick pattern.
- Use tight stop-loss orders to manage risk.
3. Combining MAD with RSI
Pair MAD with the Relative Strength Index (RSI) for more precise entries:
- A golden cross + RSI below 30 = Strong buy signal.
- A death cross + RSI above 70 = Strong sell signal.
4. Multiple Timeframe Analysis
Use MAD on multiple timeframes to confirm trends:
- A golden cross on a 4-hour chart supported by a similar signal on the daily chart increases the likelihood of a successful trade.
7. Real-World Example: BTC/USD
Let’s analyze the BTC/USD pair using a 50-period SMA (long-term) and a 20-period EMA (short-term).
Scenario: November 2024 Bull Run
- Golden Cross Signal:
- On October 25, the 20 EMA crossed above the 50 SMA at $85,000, signaling the start of a bullish trend.
- BTC subsequently surged past $90,000.
- Death Cross Signal:
- A death cross formed briefly in early November during consolidation but was invalidated as BTC broke resistance levels, highlighting the importance of confirming signals with volume and price action.
Conclusion
The Moving Average Double (MAD) indicator is a powerful yet straightforward tool for identifying trends and generating buy/sell signals. By understanding its strengths, limitations, and applications, traders can incorporate MAD into their strategies for more informed decision-making. Whether you’re a day trader or a long-term investor, mastering MAD can enhance your ability to navigate volatile markets.


Responses