LEARN VOLUME OSCILLATOR INDEX IN 3 MINUTES – BLOCKCHAIN 101
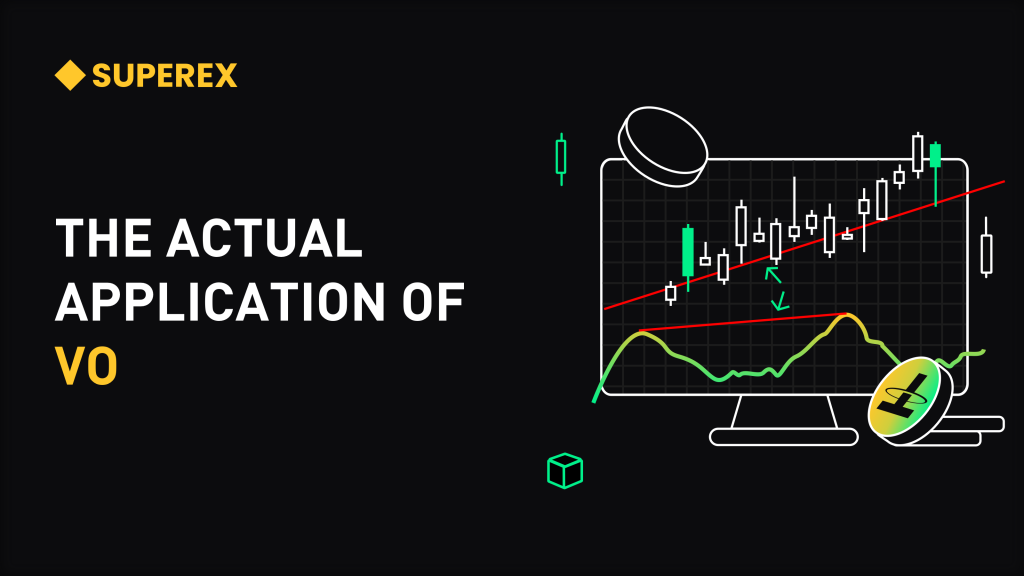
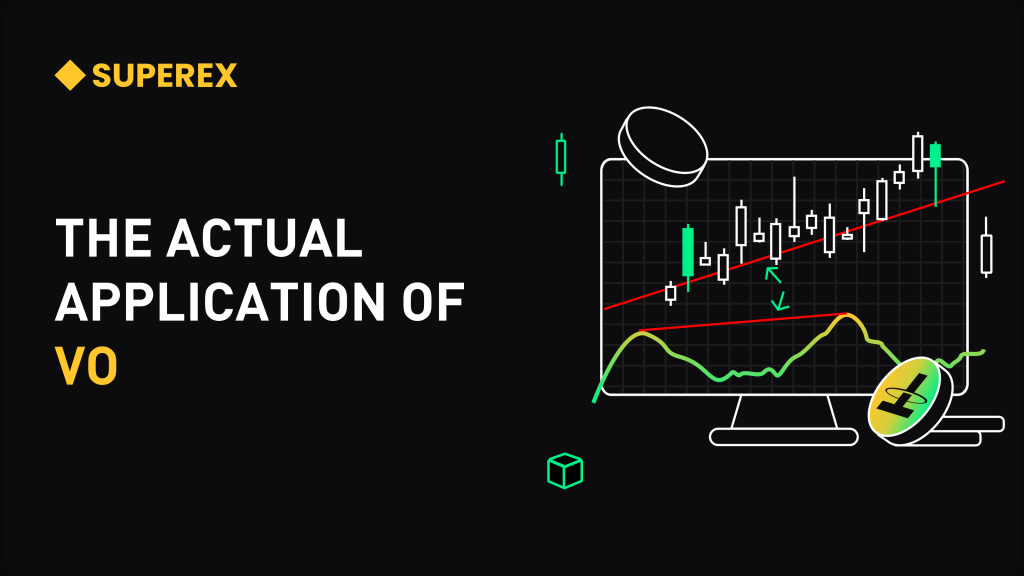
In the cryptocurrency market, price fluctuations are often one of the most closely monitored indicators. However, experienced investors know that changes in trading volume are equally crucial, serving as an important signal for assessing market activity and trend strength. The Volume Oscillator (VO) is a tool that helps investors better understand market sentiment and trends. In this article, we will explore the workings of the Volume Oscillator, its usage methods, and how it can assist in capturing market trends to inform trading decisions.
What is the Volume Oscillator?
The Volume Oscillator is a technical analysis indicator that measures market momentum by comparing the average trading volumes of two different periods. Specifically, the VO reflects the relative changes in short-term and long-term trading volumes, aiming to identify the acceleration or deceleration of trading volume, thereby helping traders determine whether the market is about to reverse or continue its current trend.
The formula for the Volume Oscillator is as follows:

Where:
- Short-term average trading volumetypically refers to shorter moving average trading volumes, such as 5-day or 10-day averages.
- Long-term average trading volumeusually refers to longer moving average trading volumes, such as 20-day or 30-day averages.
By comparing the differences between short-term and long-term trading volumes, the VO can help investors better understand whether the current market strength is increasing or decreasing.
Interpreting the Volume Oscillator
The readings of the Volume Oscillator can be categorized into two scenarios:
- Positive (+): When the VO is positive, it indicates that the short-term trading volume exceeds the long-term trading volume. This suggests that the market is exhibiting more trading activity in the short term, potentially signaling that the market trend is accelerating and that market participants have strong confidence in the current trend. Positive VO readings often occur at the beginning of a strong uptrend or downtrend, indicating the continuation of the trend.
- Negative (-): When the VO is negative, it indicates that the short-term trading volume is below the long-term trading volume. This suggests that trading activity in the market is decreasing, potentially indicating a weakening momentum of the trend or an impending reversal. Negative VO readings often appear at the tail end of a trend or during market weakness, suggesting that investors may begin to reduce their participation, indicating a potential market correction.
How to Trade with the Volume Oscillator
The advantage of the Volume Oscillator lies in its ability to provide important information about market trading activity, helping investors assess whether a trend has enough momentum to continue. Here are some common ways to use it:
- Capturing Accelerated Market Trends: When the Volume Oscillator begins to transition from negative to positive, it often signals an acceleration of the market trend. This means that short-term trading volume is starting to exceed long-term trading volume, indicating increased interest from market participants, which could drive prices further up or down. In this case, traders might consider entering or adding to positions in line with the trend.
- Identifying Potential Trend Reversals: If the VO shifts from positive to negative, accompanied by stagnation or weakness in price trends, this could be an early signal of an impending market reversal. A decrease in trading volume may indicate that participants have lost confidence in the current trend, suggesting the market may enter a correction phase. At this point, investors might consider reducing their positions or preparing for a potential market reversal.
- Using in Conjunction with Other Technical Indicators: Relying solely on the Volume Oscillator may not always yield accurate results, especially in choppy markets. Combining the VO with other technical indicators, such as the Relative Strength Index (RSI), Moving Averages (MA), or Bollinger Bands, can improve the accuracy of trading decisions. For instance, when the VO shows a decrease in market momentum while the RSI reaches overbought or oversold levels, this may signal a strong reversal.
- Monitoring Abnormal Volume Points: The Volume Oscillator can also help investors identify unusual changes in trading volume. For example, when the VO suddenly spikes, indicating a significant increase in trading activity over a short period, this could be triggered by major news or shifts in market sentiment. During these moments, investors need to remain particularly vigilant about market volatility and adjust their strategies accordingly.
Advantages and Disadvantages of the Volume Oscillator
Advantages:
- High Sensitivity:The VO can quickly reflect changes in market trading volume, helping investors capture acceleration or deceleration in market trends in a timely manner.
- Simplicity:Compared to some complex technical analysis tools, the calculation and interpretation of the VO are relatively straightforward, making it suitable for beginners.
- Capturing Market Sentiment:Trading volume is often seen as a barometer of market sentiment. By analyzing changes in trading volume, the VO can help investors better understand market mood.
Disadvantages:
- Susceptible to Short-term Fluctuations:Since the VO is based on the comparison of short-term and long-term trading volumes, it may produce false signals in choppy markets.
- Need for Combination with Other Indicators:Relying solely on the VO may not be sufficient for making accurate trading decisions, especially when market trends are unclear. Therefore, investors often need to integrate other technical indicators for comprehensive analysis.
Practical Application Case of the Volume Oscillator
To better understand the practical application of the Volume Oscillator, let’s consider an example.
Suppose we are analyzing a MEME coin. During a certain period, the VO rises slowly from negative to positive, indicating that market trading volume has significantly increased in the short term. At this point, prices also begin to rise gradually. Based on the VO signal, investors can determine that buying pressure in the market is strengthening, and the trend may continue. In this case, investors may choose to buy in line with the upward market trend.
However, as the VO reaches a peak and then quickly declines, it indicates that short-term trading volume is beginning to shrink. At this time, prices also enter a phase of sideways consolidation. Based on the changes in the VO, investors can judge that market momentum is weakening, and it may be time to consider reducing positions to avoid potential market corrections.
The Volume Oscillator is an effective technical analysis tool that helps investors identify the acceleration or deceleration of market trends. By analyzing the relative changes in short-term and long-term trading volumes, the VO can provide key insights into market sentiment and trend momentum. Although the VO is not flawless and can be influenced by short-term fluctuations, when combined with other technical indicators, it can play an important role in trend trading.
Whether capturing trend acceleration or identifying potential trend reversals, the Volume Oscillator can be a powerful tool for investors. In future trading, consider incorporating the Volume Oscillator into your technical analysis framework to enhance the accuracy of your trading decisions.






Responses