LEARN LEAST SQUARES MOVING AVERAGE IN 3 MINUTES – BLOCKCHAIN 101

Least Squares Moving Average, or LSMA for short, is a tool used for technical analysis of financial markets, primarily used to smooth price data and identify trends. Unlike traditional moving averages (such as the simple moving average SMA), LSMA uses a linear regression method to fit a straight line through the data points, and then plots the value of the straight line as a moving average. This makes LSMA better at predicting future price movements because it is designed to minimize the sum of squared errors between the actual price and the price predicted by the linear model.

Historical background of LSMA
The concept of LSMA was first proposed by German mathematician Carl Friedrich Gauss in the early 19th century. Originally, this method was developed to reduce errors in astronomical observations, but it was quickly adopted in a variety of fields, including economics, financial markets, and engineering.
In financial markets, technical analysts began to use LSMA to process price data in order to obtain more accurate market trend analysis. Over time, LSMA has gradually become a unique analytical tool, especially in complex markets, which can help traders more clearly identify the main trends in prices.
LSMA calculation method
The calculation of LSMA is based on the linear regression equation, which is implemented through the following steps:
Select a time period: First, select the time period you want to analyze, such as 14 days or 30 days.
Calculate the linear regression equation: Perform a linear regression analysis on each price data point during the selected period to determine the linear trend of the data. The form of the linear regression equation is:
y=mx+by
where m is the slope, b is the intercept, y is the price value, and x is the time value.
- Fitting linear trend: Through the least squares method, the best fitting straight line is calculated, that is, the straight line that best reflects the trend of price data.
- Draw a moving average: Use the calculated straight line value as the moving average at each time point to draw the LSMA curve.
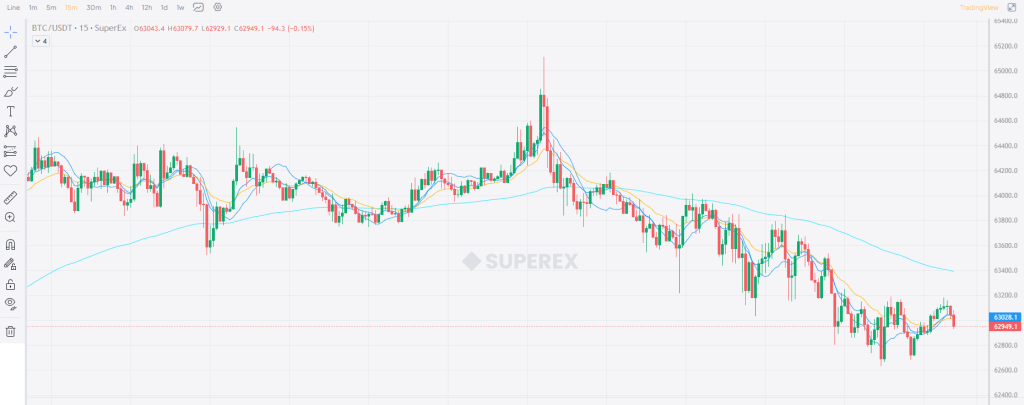
The picture below is the LSMA line spectrum drawn by SuperEx for users. The blue curve is the LSMA line spectrum. You can refer to it directly:
Applications of LSMA
In practical applications, LSMA is often used in the following scenarios:
- Trend identification: LSMA can more sensitively capture changes in price trends and help traders follow the trend in a timely manner.
- Price prediction: Through the fitted linear trend, LSMA can be used as a prediction tool for future price trends, especially when there is an obvious trend in the market.
- Signal Confirmation: When used in conjunction with other technical indicators, LSMA can be used to confirm buy and sell signals, especially when price breaks above LSMA.
Advantages and limitations of LSMA
Advantages:
Compared with the simple moving average, LSMA is more responsive to price trends and can identify trend changes earlier.
By minimizing errors, LSMA provides smoother curves and reduces noise in volatile markets.
Limitations:
In a volatile markets with no obvious trend, LSMA can produce misleading signals.
For shorter time periods, the LSMA may be too sensitive, causing traders to frequently enter and exit the market.
In conclusion
LSMA is a very useful technical analysis tool, especially in trending markets. It can more accurately reflect the main trends and potential directions of the market through linear regression. However, when using LSMA, traders also need to combine other technical indicators and market background to avoid misleading caused by a single indicator.




Responses